Data
457,927 items of data are available, covering 210,739 participants.
Defined-instances run from 0 to 4, labelled using Instancing
1.
Units of measurement are ug.
| Maximum | 41446 |
| Decile 9 | 1672.15 |
| Decile 8 | 1302.02 |
| Decile 7 | 1034.14 |
| Decile 6 | 810.541 |
| Median | 666.18 |
| Decile 4 | 553.794 |
| Decile 3 | 456.08 |
| Decile 2 | 362.546 |
| Decile 1 | 257.352 |
| Minimum | 0 |
|

|
- Mean = 971.195
- Std.dev = 1270.1
- 12903 items above graph maximum of 3086.94
|
5 Instances
Instance 0 : Conducted in assessment centre, April 2009 to September 2010.
70,630 participants, 70,630 items
| Maximum | 39234.3 |
| Decile 9 | 1703.22 |
| Decile 8 | 1320.78 |
| Decile 7 | 1044.37 |
| Decile 6 | 806.997 |
| Median | 653.297 |
| Decile 4 | 537.219 |
| Decile 3 | 437.697 |
| Decile 2 | 345.291 |
| Decile 1 | 242.113 |
| Minimum | 0 |
|
|
- Mean = 949.473
- Std.dev = 1214.33
- 1699 items above graph maximum of 3164.34
|
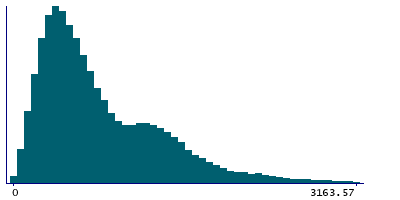
Instance 1 : On-line cycle 1, February 2011 to April 2011.
100,447 participants, 100,447 items
| Maximum | 39447.9 |
| Decile 9 | 1712.27 |
| Decile 8 | 1332.97 |
| Decile 7 | 1076.96 |
| Decile 6 | 839.19 |
| Median | 686.77 |
| Decile 4 | 568.919 |
| Decile 3 | 466.642 |
| Decile 2 | 370.769 |
| Decile 1 | 263.829 |
| Minimum | 0 |
|
|
- Mean = 1000.2
- Std.dev = 1291.92
- 2973 items above graph maximum of 3160.71
|
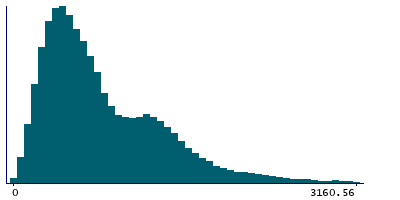
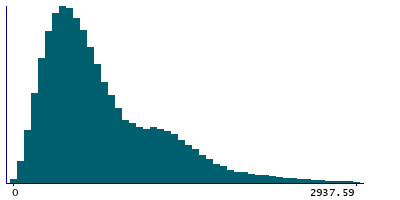
Instance 2 : On-line cycle 2, June 2011 to September 2011.
83,140 participants, 83,140 items
| Maximum | 41446 |
| Decile 9 | 1597.28 |
| Decile 8 | 1241.24 |
| Decile 7 | 963.254 |
| Decile 6 | 770.804 |
| Median | 641.383 |
| Decile 4 | 539.5 |
| Decile 3 | 448.352 |
| Decile 2 | 359.171 |
| Decile 1 | 256.865 |
| Minimum | 0 |
|
|
- Mean = 935.416
- Std.dev = 1267.18
- 2308 items above graph maximum of 2937.69
|
Instance 3 : On-line cycle 3, October 2011 to December 2011.
103,616 participants, 103,616 items
| Maximum | 39623.5 |
| Decile 9 | 1712.5 |
| Decile 8 | 1331.71 |
| Decile 7 | 1078.29 |
| Decile 6 | 845.12 |
| Median | 689.341 |
| Decile 4 | 570.767 |
| Decile 3 | 467.563 |
| Decile 2 | 371.26 |
| Decile 1 | 262.53 |
| Minimum | 0 |
|

|
- Mean = 1004.53
- Std.dev = 1306.45
- 3024 items above graph maximum of 3162.46
|
Instance 4 : On-line cycle 4, April 2012 to June 2012.
100,094 participants, 100,094 items
| Maximum | 39541.5 |
| Decile 9 | 1636.87 |
| Decile 8 | 1271 |
| Decile 7 | 995.568 |
| Decile 6 | 789.497 |
| Median | 654.316 |
| Decile 4 | 547.024 |
| Decile 3 | 454.036 |
| Decile 2 | 361.558 |
| Decile 1 | 257.524 |
| Minimum | 0 |
|

|
- Mean = 952.624
- Std.dev = 1249.11
- 2810 items above graph maximum of 3016.21
|
