Data
457,927 items of data are available, covering 210,739 participants.
Defined-instances run from 0 to 4, labelled using Instancing
1.
Units of measurement are ug.
| Maximum | 773.952 |
| Decile 9 | 89.3945 |
| Decile 8 | 71.1251 |
| Decile 7 | 60.1914 |
| Decile 6 | 52.2235 |
| Median | 45.8347 |
| Decile 4 | 40.5066 |
| Decile 3 | 35.5397 |
| Decile 2 | 30.245 |
| Decile 1 | 23.6133 |
| Minimum | 0 |
|

|
- Mean = 52.3998
- Std.dev = 28.8581
- 3539 items above graph maximum of 155.176
|
5 Instances
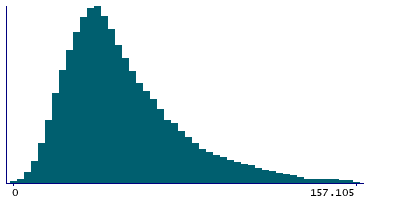
Instance 0 : Conducted in assessment centre, April 2009 to September 2010.
70,630 participants, 70,630 items
| Maximum | 710.311 |
| Decile 9 | 89.6584 |
| Decile 8 | 70.5846 |
| Decile 7 | 59.4462 |
| Decile 6 | 51.2492 |
| Median | 44.8224 |
| Decile 4 | 39.4099 |
| Decile 3 | 34.4008 |
| Decile 2 | 28.9738 |
| Decile 1 | 22.2478 |
| Minimum | 0 |
|
|
- Mean = 51.6739
- Std.dev = 29.9524
- 574 items above graph maximum of 157.069
|
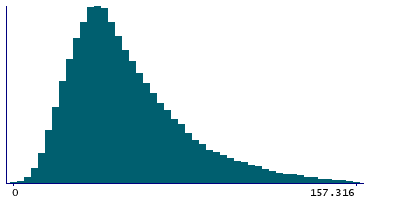
Instance 1 : On-line cycle 1, February 2011 to April 2011.
100,447 participants, 100,447 items
| Maximum | 560.098 |
| Decile 9 | 89.8704 |
| Decile 8 | 71.5246 |
| Decile 7 | 60.4929 |
| Decile 6 | 52.4806 |
| Median | 46.1579 |
| Decile 4 | 40.8309 |
| Decile 3 | 35.9326 |
| Decile 2 | 30.6735 |
| Decile 1 | 24.107 |
| Minimum | 0 |
|

|
- Mean = 52.7622
- Std.dev = 28.6675
- 737 items above graph maximum of 155.634
|
Instance 2 : On-line cycle 2, June 2011 to September 2011.
83,140 participants, 83,140 items
| Maximum | 691.131 |
| Decile 9 | 90.4551 |
| Decile 8 | 71.7556 |
| Decile 7 | 60.6996 |
| Decile 6 | 52.7668 |
| Median | 46.294 |
| Decile 4 | 40.8254 |
| Decile 3 | 35.7908 |
| Decile 2 | 30.4762 |
| Decile 1 | 23.8105 |
| Minimum | 0 |
|

|
- Mean = 52.8932
- Std.dev = 29.243
- 643 items above graph maximum of 157.1
|
Instance 3 : On-line cycle 3, October 2011 to December 2011.
103,616 participants, 103,616 items
| Maximum | 489.769 |
| Decile 9 | 86.7593 |
| Decile 8 | 69.4055 |
| Decile 7 | 58.9964 |
| Decile 6 | 51.204 |
| Median | 45.0316 |
| Decile 4 | 39.9515 |
| Decile 3 | 35.1967 |
| Decile 2 | 30.0384 |
| Decile 1 | 23.5855 |
| Minimum | 0 |
|

|
- Mean = 51.3583
- Std.dev = 27.6915
- 817 items above graph maximum of 149.933
|
Instance 4 : On-line cycle 4, April 2012 to June 2012.
100,094 participants, 100,094 items
| Maximum | 773.952 |
| Decile 9 | 90.6621 |
| Decile 8 | 72.1627 |
| Decile 7 | 61.2453 |
| Decile 6 | 53.1955 |
| Median | 46.6814 |
| Decile 4 | 41.2422 |
| Decile 3 | 36.1265 |
| Decile 2 | 30.7521 |
| Decile 1 | 24.0208 |
| Minimum | 0 |
|
|
- Mean = 53.2165
- Std.dev = 29.0791
- 766 items above graph maximum of 157.303
|
