Data
457,927 items of data are available, covering 210,739 participants.
Defined-instances run from 0 to 4, labelled using Instancing
1.
Units of measurement are mg.
| Maximum | 7946.36 |
| Decile 9 | 1474.78 |
| Decile 8 | 1261.8 |
| Decile 7 | 1128.01 |
| Decile 6 | 1024.07 |
| Median | 932.658 |
| Decile 4 | 847.447 |
| Decile 3 | 760.888 |
| Decile 2 | 666.753 |
| Decile 1 | 545.896 |
| Minimum | 0 |
|
|
- Mean = 983.211
- Std.dev = 389.07
- 2296 items above graph maximum of 2403.65
|
5 Instances
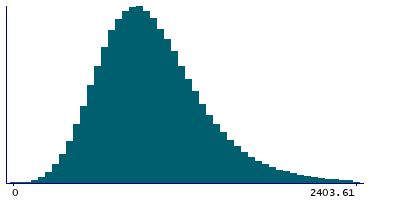
Instance 0 : Conducted in assessment centre, April 2009 to September 2010.
70,630 participants, 70,630 items
| Maximum | 7946.36 |
| Decile 9 | 1503.19 |
| Decile 8 | 1279.52 |
| Decile 7 | 1141.42 |
| Decile 6 | 1031.8 |
| Median | 935.848 |
| Decile 4 | 848.16 |
| Decile 3 | 756.664 |
| Decile 2 | 657.856 |
| Decile 1 | 533.041 |
| Minimum | 0 |
|
|
- Mean = 990.635
- Std.dev = 410.596
- 398 items above graph maximum of 2473.34
|
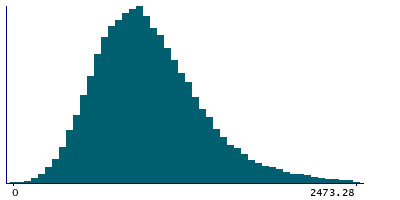
Instance 1 : On-line cycle 1, February 2011 to April 2011.
100,447 participants, 100,447 items
| Maximum | 5378.66 |
| Decile 9 | 1487.55 |
| Decile 8 | 1275.33 |
| Decile 7 | 1140.11 |
| Decile 6 | 1035.66 |
| Median | 944.108 |
| Decile 4 | 857.469 |
| Decile 3 | 770.44 |
| Decile 2 | 677.136 |
| Decile 1 | 555.263 |
| Minimum | 0 |
|
|
- Mean = 993.646
- Std.dev = 387.934
- 475 items above graph maximum of 2419.83
|
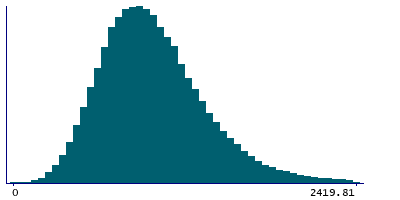
Instance 2 : On-line cycle 2, June 2011 to September 2011.
83,140 participants, 83,140 items
| Maximum | 5902.6 |
| Decile 9 | 1449.65 |
| Decile 8 | 1240.62 |
| Decile 7 | 1108.06 |
| Decile 6 | 1005.66 |
| Median | 917.04 |
| Decile 4 | 833.267 |
| Decile 3 | 749.71 |
| Decile 2 | 658.569 |
| Decile 1 | 540.21 |
| Minimum | 0 |
|
|
- Mean = 967.44
- Std.dev = 380.637
- 448 items above graph maximum of 2359.09
|
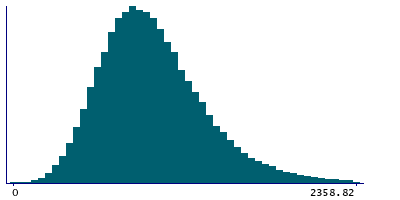
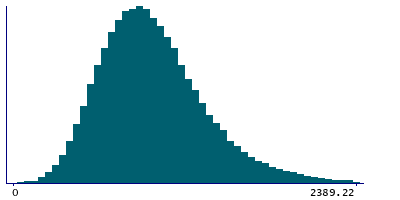
Instance 3 : On-line cycle 3, October 2011 to December 2011.
103,616 participants, 103,616 items
| Maximum | 5003.64 |
| Decile 9 | 1467.17 |
| Decile 8 | 1256.23 |
| Decile 7 | 1123.61 |
| Decile 6 | 1021.55 |
| Median | 930.934 |
| Decile 4 | 846.01 |
| Decile 3 | 759.03 |
| Decile 2 | 664.35 |
| Decile 1 | 544.847 |
| Minimum | 0 |
|
|
- Mean = 979.187
- Std.dev = 383.972
- 488 items above graph maximum of 2389.48
|
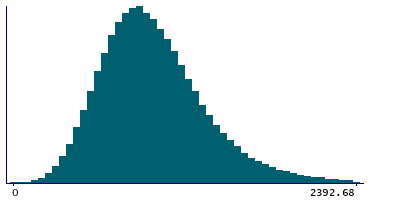
Instance 4 : On-line cycle 4, April 2012 to June 2012.
100,094 participants, 100,094 items
| Maximum | 6505.66 |
| Decile 9 | 1471.68 |
| Decile 8 | 1258.9 |
| Decile 7 | 1127.66 |
| Decile 6 | 1024.87 |
| Median | 934.274 |
| Decile 4 | 850.441 |
| Decile 3 | 765.369 |
| Decile 2 | 671.916 |
| Decile 1 | 551.192 |
| Minimum | 0 |
|
|
- Mean = 984.766
- Std.dev = 386.277
- 494 items above graph maximum of 2392.17
|
