Data
83,905 items of data are available, covering 79,378 participants.
Defined-instances run from 2 to 3, labelled using Instancing
2.
Units of measurement are AU.
| Maximum | 0.444502 |
| Decile 9 | 0.202004 |
| Decile 8 | 0.195543 |
| Decile 7 | 0.190993 |
| Decile 6 | 0.187255 |
| Median | 0.183757 |
| Decile 4 | 0.180333 |
| Decile 3 | 0.176774 |
| Decile 2 | 0.172644 |
| Decile 1 | 0.166947 |
| Minimum | 0 |
|
|
- Mean = 0.184251
- Std.dev = 0.0143674
- 16 items below graph minimum of 0.13189
- 117 items above graph maximum of 0.237061
|
2 Instances
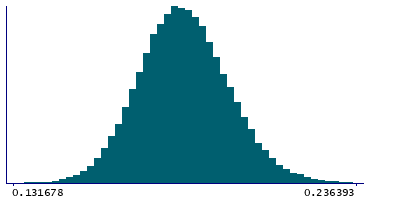
Instance 2 : Imaging visit (2014+)
79,147 participants, 79,147 items
| Maximum | 0.444502 |
| Decile 9 | 0.202089 |
| Decile 8 | 0.195648 |
| Decile 7 | 0.191086 |
| Decile 6 | 0.187345 |
| Median | 0.183845 |
| Decile 4 | 0.180416 |
| Decile 3 | 0.176859 |
| Decile 2 | 0.172719 |
| Decile 1 | 0.167016 |
| Minimum | 0 |
|

|
- Mean = 0.184339
- Std.dev = 0.0143741
- 14 items below graph minimum of 0.131942
- 112 items above graph maximum of 0.237163
|
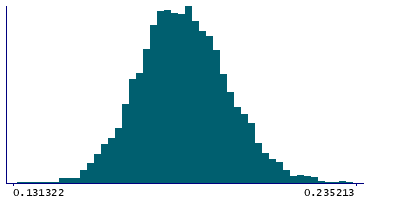
Instance 3 : First repeat imaging visit (2019+)
4,758 participants, 4,758 items
| Maximum | 0.306091 |
| Decile 9 | 0.200599 |
| Decile 8 | 0.193947 |
| Decile 7 | 0.189676 |
| Decile 6 | 0.185689 |
| Median | 0.182315 |
| Decile 4 | 0.178791 |
| Decile 3 | 0.175301 |
| Decile 2 | 0.171374 |
| Decile 1 | 0.165945 |
| Minimum | 0 |
|
|
- Mean = 0.182778
- Std.dev = 0.0141754
- 2 items below graph minimum of 0.131292
- 5 items above graph maximum of 0.235252
|
Notes
Weighted-mean OD (orientation dispersion index) in tract left medial lemniscus (from dMRI data)
0 Related Data-Fields
There are no related data-fields
2 Applications
| Application ID | Title |
|---|
| 17689 | Genetic, environmental and lifestyle predictors of brain/cognitive-related outcomes. |
| 22783 | The joint analysis of imaging data and genetic data for early tumor detection, prevention, diagnosis and treatment |

