Data
83,905 items of data are available, covering 79,378 participants.
Defined-instances run from 2 to 3, labelled using Instancing
2.
Units of measurement are AU.
| Maximum | 0.507362 |
| Decile 9 | 0.263969 |
| Decile 8 | 0.254624 |
| Decile 7 | 0.247362 |
| Decile 6 | 0.240501 |
| Median | 0.233689 |
| Decile 4 | 0.226722 |
| Decile 3 | 0.219512 |
| Decile 2 | 0.211913 |
| Decile 1 | 0.202307 |
| Minimum | 0 |
|

|
- Mean = 0.233273
- Std.dev = 0.0244665
- 55 items below graph minimum of 0.140644
- 19 items above graph maximum of 0.325632
|
2 Instances
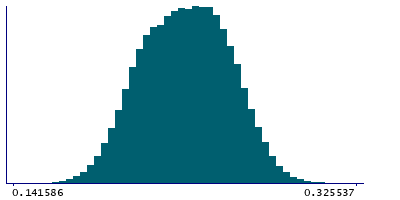
Instance 2 : Imaging visit (2014+)
79,147 participants, 79,147 items
| Maximum | 0.507362 |
| Decile 9 | 0.263707 |
| Decile 8 | 0.254319 |
| Decile 7 | 0.24707 |
| Decile 6 | 0.240203 |
| Median | 0.233373 |
| Decile 4 | 0.226467 |
| Decile 3 | 0.219239 |
| Decile 2 | 0.211635 |
| Decile 1 | 0.202071 |
| Minimum | 0 |
|
|
- Mean = 0.233014
- Std.dev = 0.0244436
- 52 items below graph minimum of 0.140436
- 19 items above graph maximum of 0.325343
|
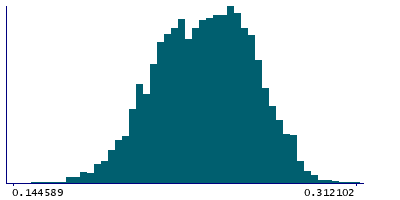
Instance 3 : First repeat imaging visit (2019+)
4,758 participants, 4,758 items
| Maximum | 0.312102 |
| Decile 9 | 0.267879 |
| Decile 8 | 0.259033 |
| Decile 7 | 0.251982 |
| Decile 6 | 0.245453 |
| Median | 0.2387 |
| Decile 4 | 0.231555 |
| Decile 3 | 0.224222 |
| Decile 2 | 0.216571 |
| Decile 1 | 0.206241 |
| Minimum | 0 |
|
|
- Mean = 0.237592
- Std.dev = 0.0244434
- 4 items below graph minimum of 0.144603
|
Notes
Weighted-mean OD (orientation dispersion index) in tract middle cerebellar peduncle (from dMRI data)
0 Related Data-Fields
There are no related data-fields
2 Applications
| Application ID | Title |
|---|
| 17689 | Genetic, environmental and lifestyle predictors of brain/cognitive-related outcomes. |
| 22783 | The joint analysis of imaging data and genetic data for early tumor detection, prevention, diagnosis and treatment |

