Data
83,905 items of data are available, covering 79,378 participants.
Defined-instances run from 2 to 3, labelled using Instancing
2.
Units of measurement are AU.
| Maximum | 0.987889 |
| Decile 9 | 0.634366 |
| Decile 8 | 0.624771 |
| Decile 7 | 0.617853 |
| Decile 6 | 0.612092 |
| Median | 0.606756 |
| Decile 4 | 0.601438 |
| Decile 3 | 0.595677 |
| Decile 2 | 0.58913 |
| Decile 1 | 0.580056 |
| Minimum | 0 |
|
|
- Mean = 0.607116
- Std.dev = 0.023461
- 37 items below graph minimum of 0.525745
- 100 items above graph maximum of 0.688676
|
2 Instances
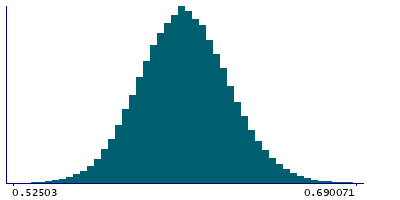
Instance 2 : Imaging visit (2014+)
79,147 participants, 79,147 items
| Maximum | 0.987889 |
| Decile 9 | 0.633995 |
| Decile 8 | 0.624366 |
| Decile 7 | 0.617453 |
| Decile 6 | 0.611721 |
| Median | 0.606397 |
| Decile 4 | 0.601056 |
| Decile 3 | 0.595324 |
| Decile 2 | 0.588828 |
| Decile 1 | 0.579773 |
| Minimum | 0 |
|

|
- Mean = 0.606766
- Std.dev = 0.0233865
- 35 items below graph minimum of 0.52555
- 98 items above graph maximum of 0.688217
|
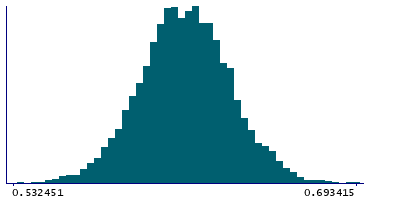
Instance 3 : First repeat imaging visit (2019+)
4,758 participants, 4,758 items
| Maximum | 0.968887 |
| Decile 9 | 0.639757 |
| Decile 8 | 0.630428 |
| Decile 7 | 0.624061 |
| Decile 6 | 0.618318 |
| Median | 0.612969 |
| Decile 4 | 0.6075 |
| Decile 3 | 0.602226 |
| Decile 2 | 0.595626 |
| Decile 1 | 0.586102 |
| Minimum | 0 |
|
|
- Mean = 0.612938
- Std.dev = 0.0239291
- 3 items below graph minimum of 0.532446
- 2 items above graph maximum of 0.693412
|
Notes
Weighted-mean ICVF (intra-cellular volume fraction) in tract right medial lemniscus (from dMRI data)
0 Related Data-Fields
There are no related data-fields
2 Applications
| Application ID | Title |
|---|
| 17689 | Genetic, environmental and lifestyle predictors of brain/cognitive-related outcomes. |
| 22783 | The joint analysis of imaging data and genetic data for early tumor detection, prevention, diagnosis and treatment |

