Data
83,909 items of data are available, covering 79,382 participants.
Defined-instances run from 2 to 3, labelled using Instancing
2.
Units of measurement are AU.
| Maximum | 0.00169418 |
| Decile 9 | 0.000511724 |
| Decile 8 | 0.000484496 |
| Decile 7 | 0.000466568 |
| Decile 6 | 0.000452075 |
| Median | 0.000439015 |
| Decile 4 | 0.000426594 |
| Decile 3 | 0.000414571 |
| Decile 2 | 0.000401554 |
| Decile 1 | 0.000385555 |
| Minimum | 0 |
|
|
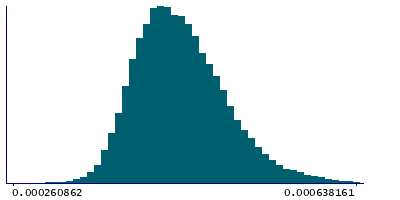
- Mean = 0.000444792
- Std.dev = 5.36157e-05
- 51 items below graph minimum of 0.000259386
- 311 items above graph maximum of 0.000637894
|
2 Instances
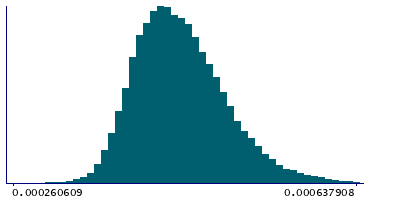
Instance 2 : Imaging visit (2014+)
79,151 participants, 79,151 items
| Maximum | 0.00169418 |
| Decile 9 | 0.000512288 |
| Decile 8 | 0.00048489 |
| Decile 7 | 0.000467008 |
| Decile 6 | 0.000452444 |
| Median | 0.000439453 |
| Decile 4 | 0.00042698 |
| Decile 3 | 0.000415015 |
| Decile 2 | 0.000402001 |
| Decile 1 | 0.000386096 |
| Minimum | 0 |
|
|
- Mean = 0.00044527
- Std.dev = 5.37274e-05
- 48 items below graph minimum of 0.000259903
- 305 items above graph maximum of 0.00063848
|
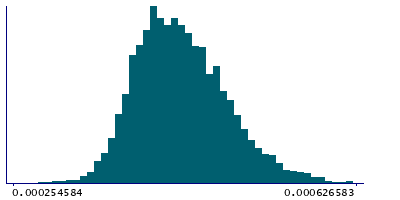
Instance 3 : First repeat imaging visit (2019+)
4,758 participants, 4,758 items
| Maximum | 0.000672841 |
| Decile 9 | 0.000502633 |
| Decile 8 | 0.000477365 |
| Decile 7 | 0.000459899 |
| Decile 6 | 0.000445262 |
| Median | 0.00043226 |
| Decile 4 | 0.000419284 |
| Decile 3 | 0.00040702 |
| Decile 2 | 0.000394363 |
| Decile 1 | 0.000378549 |
| Minimum | 0 |
|
|
- Mean = 0.000436846
- Std.dev = 5.10707e-05
- 3 items below graph minimum of 0.000254464
- 7 items above graph maximum of 0.000626718
|
Notes
Weighted-mean L3 in tract middle cerebellar peduncle (from dMRI data)
0 Related Data-Fields
There are no related data-fields
2 Applications
| Application ID | Title |
|---|
| 17689 | Genetic, environmental and lifestyle predictors of brain/cognitive-related outcomes. |
| 22783 | The joint analysis of imaging data and genetic data for early tumor detection, prevention, diagnosis and treatment |

