Data
83,909 items of data are available, covering 79,382 participants.
Defined-instances run from 2 to 3, labelled using Instancing
2.
Units of measurement are AU.
| Maximum | 0.632698 |
| Decile 9 | 0.502658 |
| Decile 8 | 0.47874 |
| Decile 7 | 0.460362 |
| Decile 6 | 0.44446 |
| Median | 0.429233 |
| Decile 4 | 0.413936 |
| Decile 3 | 0.397157 |
| Decile 2 | 0.3776 |
| Decile 1 | 0.349581 |
| Minimum | 0 |
|
|
- Mean = 0.427416
- Std.dev = 0.0597494
- 27 items below graph minimum of 0.196503
|
2 Instances
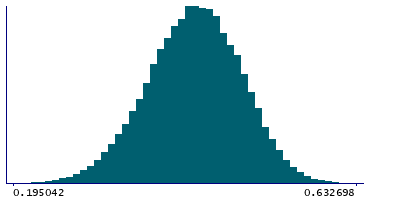
Instance 2 : Imaging visit (2014+)
79,151 participants, 79,151 items
| Maximum | 0.632698 |
| Decile 9 | 0.502966 |
| Decile 8 | 0.478962 |
| Decile 7 | 0.460566 |
| Decile 6 | 0.444677 |
| Median | 0.429477 |
| Decile 4 | 0.414206 |
| Decile 3 | 0.397323 |
| Decile 2 | 0.377772 |
| Decile 1 | 0.349728 |
| Minimum | 0 |
|

|
- Mean = 0.427636
- Std.dev = 0.0598112
- 24 items below graph minimum of 0.19649
|
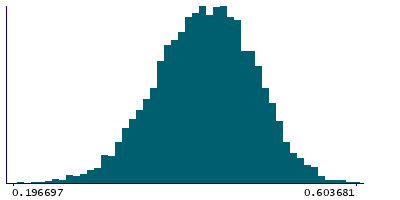
Instance 3 : First repeat imaging visit (2019+)
4,758 participants, 4,758 items
| Maximum | 0.603681 |
| Decile 9 | 0.497524 |
| Decile 8 | 0.474665 |
| Decile 7 | 0.456555 |
| Decile 6 | 0.441166 |
| Median | 0.425439 |
| Decile 4 | 0.41046 |
| Decile 3 | 0.393826 |
| Decile 2 | 0.374614 |
| Decile 1 | 0.347128 |
| Minimum | 0.101528 |
|
|
- Mean = 0.42375
- Std.dev = 0.0585912
- 3 items below graph minimum of 0.196731
|
Notes
Weighted-mean MO (diffusion tensor mode) in tract right superior thalamic radiation (from dMRI data)
0 Related Data-Fields
There are no related data-fields
2 Applications
| Application ID | Title |
|---|
| 17689 | Genetic, environmental and lifestyle predictors of brain/cognitive-related outcomes. |
| 22783 | The joint analysis of imaging data and genetic data for early tumor detection, prevention, diagnosis and treatment |

