Data
83,909 items of data are available, covering 79,382 participants.
Defined-instances run from 2 to 3, labelled using Instancing
2.
Units of measurement are AU.
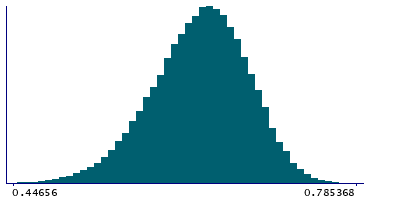
| Maximum | 0.785368 |
| Decile 9 | 0.688693 |
| Decile 8 | 0.670744 |
| Decile 7 | 0.656982 |
| Decile 6 | 0.644971 |
| Median | 0.633269 |
| Decile 4 | 0.621098 |
| Decile 3 | 0.607404 |
| Decile 2 | 0.591125 |
| Decile 1 | 0.567594 |
| Minimum | 0 |
|

|
- Mean = 0.630046
- Std.dev = 0.0488279
- 71 items below graph minimum of 0.446494
|
2 Instances
Instance 2 : Imaging visit (2014+)
79,151 participants, 79,151 items
| Maximum | 0.785368 |
| Decile 9 | 0.688766 |
| Decile 8 | 0.670842 |
| Decile 7 | 0.657054 |
| Decile 6 | 0.645041 |
| Median | 0.633308 |
| Decile 4 | 0.621132 |
| Decile 3 | 0.60747 |
| Decile 2 | 0.591183 |
| Decile 1 | 0.567718 |
| Minimum | 0 |
|
|
- Mean = 0.63012
- Std.dev = 0.0487658
- 66 items below graph minimum of 0.446671
|
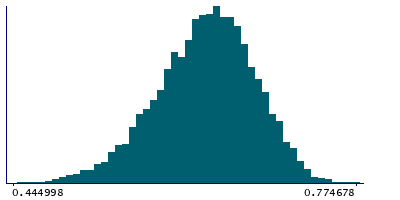
Instance 3 : First repeat imaging visit (2019+)
4,758 participants, 4,758 items
| Maximum | 0.774678 |
| Decile 9 | 0.687578 |
| Decile 8 | 0.669211 |
| Decile 7 | 0.655745 |
| Decile 6 | 0.643758 |
| Median | 0.632548 |
| Decile 4 | 0.620307 |
| Decile 3 | 0.606406 |
| Decile 2 | 0.590459 |
| Decile 1 | 0.566234 |
| Minimum | 0 |
|
|
- Mean = 0.628816
- Std.dev = 0.0498334
- 5 items below graph minimum of 0.444889
|
Notes
Weighted-mean MO (diffusion tensor mode) in tract left corticospinal tract (from dMRI data)
0 Related Data-Fields
There are no related data-fields
Problem running reference query
0 Resources
There are no matching Resources
2 Applications
| Application ID | Title |
|---|
| 17689 | Genetic, environmental and lifestyle predictors of brain/cognitive-related outcomes. |
| 22783 | The joint analysis of imaging data and genetic data for early tumor detection, prevention, diagnosis and treatment |
