Data
83,909 items of data are available, covering 79,382 participants.
Defined-instances run from 2 to 3, labelled using Instancing
2.
Units of measurement are AU.
| Maximum | 0.0013848 |
| Decile 9 | 0.00081437 |
| Decile 8 | 0.000801755 |
| Decile 7 | 0.000793357 |
| Decile 6 | 0.000786302 |
| Median | 0.00077991 |
| Decile 4 | 0.000773622 |
| Decile 3 | 0.000767166 |
| Decile 2 | 0.000759636 |
| Decile 1 | 0.000749369 |
| Minimum | 0 |
|

|
- Mean = 0.000780969
- Std.dev = 2.99606e-05
- 38 items below graph minimum of 0.000684369
- 196 items above graph maximum of 0.000879371
|
2 Instances
Instance 2 : Imaging visit (2014+)
79,151 participants, 79,151 items
| Maximum | 0.0013848 |
| Decile 9 | 0.000814525 |
| Decile 8 | 0.00080185 |
| Decile 7 | 0.000793461 |
| Decile 6 | 0.000786386 |
| Median | 0.000779992 |
| Decile 4 | 0.000773692 |
| Decile 3 | 0.000767214 |
| Decile 2 | 0.000759673 |
| Decile 1 | 0.000749374 |
| Minimum | 0 |
|

|
- Mean = 0.000781068
- Std.dev = 2.98526e-05
- 35 items below graph minimum of 0.000684223
- 184 items above graph maximum of 0.000879676
|
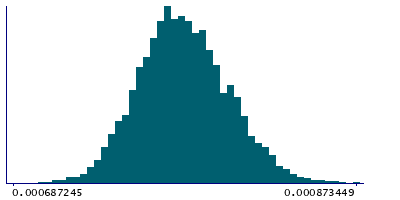
Instance 3 : First repeat imaging visit (2019+)
4,758 participants, 4,758 items
| Maximum | 0.000975968 |
| Decile 9 | 0.000811401 |
| Decile 8 | 0.000799796 |
| Decile 7 | 0.000791626 |
| Decile 6 | 0.000784985 |
| Median | 0.000778583 |
| Decile 4 | 0.000772347 |
| Decile 3 | 0.000766267 |
| Decile 2 | 0.000759164 |
| Decile 1 | 0.000749322 |
| Minimum | 0 |
|
|
- Mean = 0.000779324
- Std.dev = 3.16593e-05
- 3 items below graph minimum of 0.000687242
- 9 items above graph maximum of 0.000873481
|
Notes
Weighted-mean MD (mean diffusivity) in tract right corticospinal tract (from dMRI data)
0 Related Data-Fields
There are no related data-fields
2 Applications
| Application ID | Title |
|---|
| 17689 | Genetic, environmental and lifestyle predictors of brain/cognitive-related outcomes. |
| 22783 | The joint analysis of imaging data and genetic data for early tumor detection, prevention, diagnosis and treatment |

