Data
83,909 items of data are available, covering 79,382 participants.
Defined-instances run from 2 to 3, labelled using Instancing
2.
Units of measurement are AU.
| Maximum | 0.469062 |
| Decile 9 | 0.409002 |
| Decile 8 | 0.399963 |
| Decile 7 | 0.393561 |
| Decile 6 | 0.387852 |
| Median | 0.382596 |
| Decile 4 | 0.377248 |
| Decile 3 | 0.371566 |
| Decile 2 | 0.36483 |
| Decile 1 | 0.355113 |
| Minimum | 0 |
|
|
- Mean = 0.382164
- Std.dev = 0.0218604
- 90 items below graph minimum of 0.301225
- 6 items above graph maximum of 0.46289
|
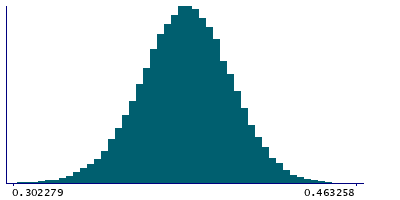
2 Instances
Instance 2 : Imaging visit (2014+)
79,151 participants, 79,151 items
| Maximum | 0.469062 |
| Decile 9 | 0.409018 |
| Decile 8 | 0.399937 |
| Decile 7 | 0.393557 |
| Decile 6 | 0.387838 |
| Median | 0.382578 |
| Decile 4 | 0.377228 |
| Decile 3 | 0.371514 |
| Decile 2 | 0.364761 |
| Decile 1 | 0.35501 |
| Minimum | 0 |
|

|
- Mean = 0.382122
- Std.dev = 0.0219394
- 88 items below graph minimum of 0.301002
- 5 items above graph maximum of 0.463025
|
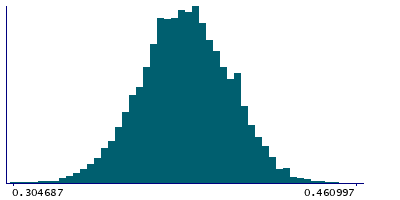
Instance 3 : First repeat imaging visit (2019+)
4,758 participants, 4,758 items
| Maximum | 0.468193 |
| Decile 9 | 0.408873 |
| Decile 8 | 0.40036 |
| Decile 7 | 0.393611 |
| Decile 6 | 0.388128 |
| Median | 0.382948 |
| Decile 4 | 0.377533 |
| Decile 3 | 0.372112 |
| Decile 2 | 0.366017 |
| Decile 1 | 0.356788 |
| Minimum | 0.262769 |
|
|
- Mean = 0.382848
- Std.dev = 0.0204902
- 2 items below graph minimum of 0.304703
- 1 item above graph maximum of 0.460958
|
Notes
Weighted-mean FA (fractional anisotropy) in tract right uncinate fasciculus (from dMRI data)
0 Related Data-Fields
There are no related data-fields
2 Applications
| Application ID | Title |
|---|
| 17689 | Genetic, environmental and lifestyle predictors of brain/cognitive-related outcomes. |
| 22783 | The joint analysis of imaging data and genetic data for early tumor detection, prevention, diagnosis and treatment |

