Data
83,909 items of data are available, covering 79,382 participants.
Defined-instances run from 2 to 3, labelled using Instancing
2.
Units of measurement are AU.
| Maximum | 0.551967 |
| Decile 9 | 0.449494 |
| Decile 8 | 0.440372 |
| Decile 7 | 0.434136 |
| Decile 6 | 0.428914 |
| Median | 0.424091 |
| Decile 4 | 0.419338 |
| Decile 3 | 0.414275 |
| Decile 2 | 0.408465 |
| Decile 1 | 0.400089 |
| Minimum | 0 |
|
|
- Mean = 0.424513
- Std.dev = 0.0204422
- 63 items below graph minimum of 0.350684
- 83 items above graph maximum of 0.498898
|
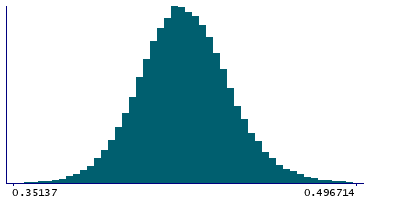
2 Instances
Instance 2 : Imaging visit (2014+)
79,151 participants, 79,151 items
| Maximum | 0.551967 |
| Decile 9 | 0.449573 |
| Decile 8 | 0.440466 |
| Decile 7 | 0.434199 |
| Decile 6 | 0.428953 |
| Median | 0.424107 |
| Decile 4 | 0.419336 |
| Decile 3 | 0.414277 |
| Decile 2 | 0.408445 |
| Decile 1 | 0.400102 |
| Minimum | 0 |
|

|
- Mean = 0.424552
- Std.dev = 0.0205219
- 61 items below graph minimum of 0.350631
- 80 items above graph maximum of 0.499045
|
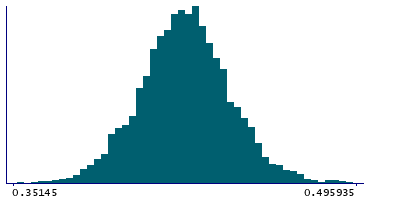
Instance 3 : First repeat imaging visit (2019+)
4,758 participants, 4,758 items
| Maximum | 0.509129 |
| Decile 9 | 0.447784 |
| Decile 8 | 0.439094 |
| Decile 7 | 0.433009 |
| Decile 6 | 0.428141 |
| Median | 0.423674 |
| Decile 4 | 0.419384 |
| Decile 3 | 0.414245 |
| Decile 2 | 0.408688 |
| Decile 1 | 0.399669 |
| Minimum | 0.329816 |
|
|
- Mean = 0.423867
- Std.dev = 0.0190549
- 2 items below graph minimum of 0.351555
- 2 items above graph maximum of 0.495899
|
Notes
Weighted-mean FA (fractional anisotropy) in tract left superior thalamic radiation (from dMRI data)
0 Related Data-Fields
There are no related data-fields
2 Applications
| Application ID | Title |
|---|
| 17689 | Genetic, environmental and lifestyle predictors of brain/cognitive-related outcomes. |
| 22783 | The joint analysis of imaging data and genetic data for early tumor detection, prevention, diagnosis and treatment |

