Data
83,909 items of data are available, covering 79,382 participants.
Defined-instances run from 2 to 3, labelled using Instancing
2.
Units of measurement are AU.
| Maximum | 0.496219 |
| Decile 9 | 0.343645 |
| Decile 8 | 0.331952 |
| Decile 7 | 0.323663 |
| Decile 6 | 0.316576 |
| Median | 0.309939 |
| Decile 4 | 0.303017 |
| Decile 3 | 0.295306 |
| Decile 2 | 0.285751 |
| Decile 1 | 0.270088 |
| Minimum | 0 |
|
|
- Mean = 0.307632
- Std.dev = 0.031156
- 386 items below graph minimum of 0.19653
- 8 items above graph maximum of 0.417203
|
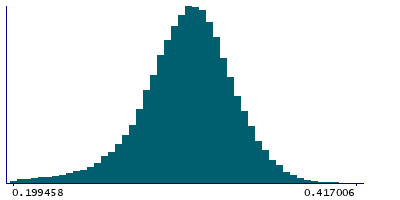
2 Instances
Instance 2 : Imaging visit (2014+)
79,151 participants, 79,151 items
| Maximum | 0.478543 |
| Decile 9 | 0.343663 |
| Decile 8 | 0.331956 |
| Decile 7 | 0.323663 |
| Decile 6 | 0.316569 |
| Median | 0.309915 |
| Decile 4 | 0.302955 |
| Decile 3 | 0.295259 |
| Decile 2 | 0.285644 |
| Decile 1 | 0.269907 |
| Minimum | 0 |
|

|
- Mean = 0.307577
- Std.dev = 0.031227
- 365 items below graph minimum of 0.196151
- 7 items above graph maximum of 0.417418
|
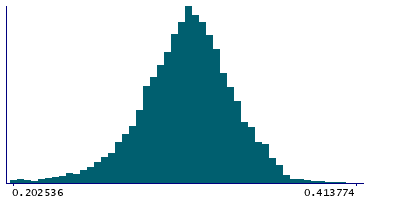
Instance 3 : First repeat imaging visit (2019+)
4,758 participants, 4,758 items
| Maximum | 0.496219 |
| Decile 9 | 0.343352 |
| Decile 8 | 0.331776 |
| Decile 7 | 0.323644 |
| Decile 6 | 0.316735 |
| Median | 0.310414 |
| Decile 4 | 0.303959 |
| Decile 3 | 0.29649 |
| Decile 2 | 0.286891 |
| Decile 1 | 0.272941 |
| Minimum | 0 |
|
|
- Mean = 0.308548
- Std.dev = 0.0299347
- 21 items below graph minimum of 0.20253
- 2 items above graph maximum of 0.413763
|
Notes
Weighted-mean FA (fractional anisotropy) in tract left parahippocampal part of cingulum (from dMRI data)
0 Related Data-Fields
There are no related data-fields
2 Applications
| Application ID | Title |
|---|
| 17689 | Genetic, environmental and lifestyle predictors of brain/cognitive-related outcomes. |
| 22783 | The joint analysis of imaging data and genetic data for early tumor detection, prevention, diagnosis and treatment |

