Data
83,909 items of data are available, covering 79,382 participants.
Defined-instances run from 2 to 3, labelled using Instancing
2.
Units of measurement are AU.
| Maximum | 0.664343 |
| Decile 9 | 0.573772 |
| Decile 8 | 0.559058 |
| Decile 7 | 0.548361 |
| Decile 6 | 0.539211 |
| Median | 0.530344 |
| Decile 4 | 0.521362 |
| Decile 3 | 0.511399 |
| Decile 2 | 0.499739 |
| Decile 1 | 0.482788 |
| Minimum | 0 |
|
|
- Mean = 0.528936
- Std.dev = 0.0367974
- 60 items below graph minimum of 0.391805
|
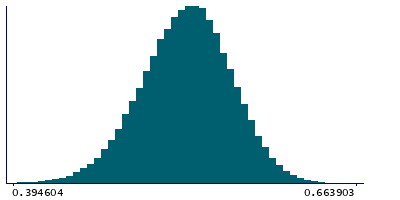
2 Instances
Instance 2 : Imaging visit (2014+)
79,151 participants, 79,151 items
| Maximum | 0.664343 |
| Decile 9 | 0.573763 |
| Decile 8 | 0.559045 |
| Decile 7 | 0.548341 |
| Decile 6 | 0.539184 |
| Median | 0.530269 |
| Decile 4 | 0.521277 |
| Decile 3 | 0.511327 |
| Decile 2 | 0.499642 |
| Decile 1 | 0.482671 |
| Minimum | 0 |
|

|
- Mean = 0.528898
- Std.dev = 0.0367737
- 56 items below graph minimum of 0.391578
|
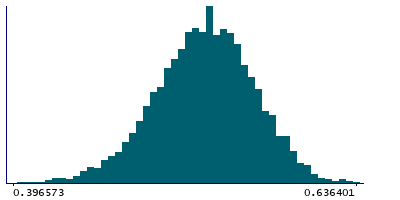
Instance 3 : First repeat imaging visit (2019+)
4,758 participants, 4,758 items
| Maximum | 0.636401 |
| Decile 9 | 0.574038 |
| Decile 8 | 0.559219 |
| Decile 7 | 0.54865 |
| Decile 6 | 0.539752 |
| Median | 0.531488 |
| Decile 4 | 0.522132 |
| Decile 3 | 0.513004 |
| Decile 2 | 0.501441 |
| Decile 1 | 0.485307 |
| Minimum | 0 |
|
|
- Mean = 0.529564
- Std.dev = 0.0371833
- 4 items below graph minimum of 0.396576
|
Notes
Weighted-mean FA (fractional anisotropy) in tract left cingulate gyrus part of cingulum (from dMRI data)
0 Related Data-Fields
There are no related data-fields
2 Applications
| Application ID | Title |
|---|
| 17689 | Genetic, environmental and lifestyle predictors of brain/cognitive-related outcomes. |
| 22783 | The joint analysis of imaging data and genetic data for early tumor detection, prevention, diagnosis and treatment |

