Data
83,906 items of data are available, covering 79,379 participants.
Defined-instances run from 2 to 3, labelled using Instancing
2.
Units of measurement are AU.
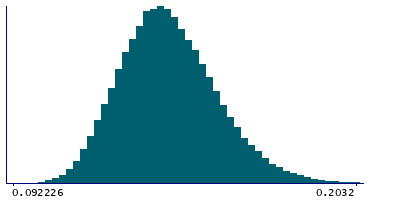
| Maximum | 0.560263 |
| Decile 9 | 0.163076 |
| Decile 8 | 0.155056 |
| Decile 7 | 0.149696 |
| Decile 6 | 0.145183 |
| Median | 0.141238 |
| Decile 4 | 0.137429 |
| Decile 3 | 0.133514 |
| Decile 2 | 0.128991 |
| Decile 1 | 0.123117 |
| Minimum | 0.09161 |
|
|
- Mean = 0.142534
- Std.dev = 0.0165936
- 188 items above graph maximum of 0.203035
|
2 Instances
Instance 2 : Imaging visit (2014+)
79,148 participants, 79,148 items
| Maximum | 0.519808 |
| Decile 9 | 0.163107 |
| Decile 8 | 0.155037 |
| Decile 7 | 0.149689 |
| Decile 6 | 0.145176 |
| Median | 0.141221 |
| Decile 4 | 0.137412 |
| Decile 3 | 0.133486 |
| Decile 2 | 0.12898 |
| Decile 1 | 0.123112 |
| Minimum | 0.09161 |
|

|
- Mean = 0.142523
- Std.dev = 0.0165612
- 176 items above graph maximum of 0.203102
|
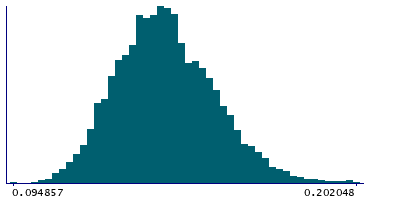
Instance 3 : First repeat imaging visit (2019+)
4,758 participants, 4,758 items
| Maximum | 0.560263 |
| Decile 9 | 0.162687 |
| Decile 8 | 0.155346 |
| Decile 7 | 0.149815 |
| Decile 6 | 0.145307 |
| Median | 0.141473 |
| Decile 4 | 0.137732 |
| Decile 3 | 0.133973 |
| Decile 2 | 0.12918 |
| Decile 1 | 0.123286 |
| Minimum | 0.094857 |
|
|
- Mean = 0.14272
- Std.dev = 0.0171222
- 9 items above graph maximum of 0.202089
|
Notes
Mean OD (orientation dispersion index) in superior longitudinal fasciculus (left) on FA (fractional anisotropy) skeleton (from dMRI data)
0 Related Data-Fields
There are no related data-fields
2 Applications
| Application ID | Title |
|---|
| 17689 | Genetic, environmental and lifestyle predictors of brain/cognitive-related outcomes. |
| 22783 | The joint analysis of imaging data and genetic data for early tumor detection, prevention, diagnosis and treatment |

