Data
83,906 items of data are available, covering 79,379 participants.
Defined-instances run from 2 to 3, labelled using Instancing
2.
Units of measurement are AU.
| Maximum | 0.566435 |
| Decile 9 | 0.171831 |
| Decile 8 | 0.159147 |
| Decile 7 | 0.150914 |
| Decile 6 | 0.144602 |
| Median | 0.138986 |
| Decile 4 | 0.133802 |
| Decile 3 | 0.128761 |
| Decile 2 | 0.123076 |
| Decile 1 | 0.115779 |
| Minimum | 0 |
|
|
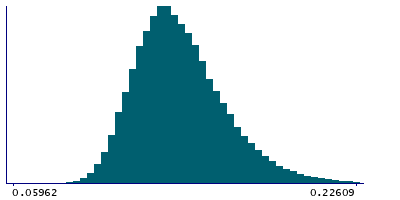
- Mean = 0.142517
- Std.dev = 0.0255729
- 3 items below graph minimum of 0.059726
- 722 items above graph maximum of 0.227884
|
2 Instances
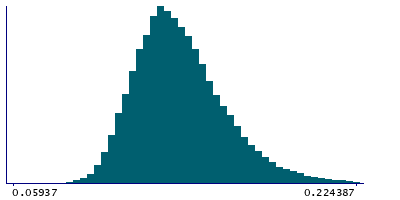
Instance 2 : Imaging visit (2014+)
79,148 participants, 79,148 items
| Maximum | 0.566435 |
| Decile 9 | 0.171907 |
| Decile 8 | 0.159176 |
| Decile 7 | 0.150938 |
| Decile 6 | 0.144655 |
| Median | 0.139042 |
| Decile 4 | 0.133837 |
| Decile 3 | 0.128783 |
| Decile 2 | 0.12309 |
| Decile 1 | 0.115776 |
| Minimum | 0 |
|
|
- Mean = 0.142552
- Std.dev = 0.0256045
- 3 items below graph minimum of 0.059645
- 683 items above graph maximum of 0.228038
|
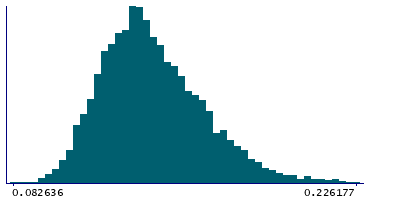
Instance 3 : First repeat imaging visit (2019+)
4,758 participants, 4,758 items
| Maximum | 0.50692 |
| Decile 9 | 0.171057 |
| Decile 8 | 0.15873 |
| Decile 7 | 0.150495 |
| Decile 6 | 0.143819 |
| Median | 0.138125 |
| Decile 4 | 0.133449 |
| Decile 3 | 0.128483 |
| Decile 2 | 0.122784 |
| Decile 1 | 0.115901 |
| Minimum | 0.082636 |
|
|
- Mean = 0.141936
- Std.dev = 0.0250344
- 34 items above graph maximum of 0.226212
|
Notes
Mean OD (orientation dispersion index) in fornix cres+stria terminalis (left) on FA (fractional anisotropy) skeleton (from dMRI data)
0 Related Data-Fields
There are no related data-fields
2 Applications
| Application ID | Title |
|---|
| 17689 | Genetic, environmental and lifestyle predictors of brain/cognitive-related outcomes. |
| 22783 | The joint analysis of imaging data and genetic data for early tumor detection, prevention, diagnosis and treatment |

