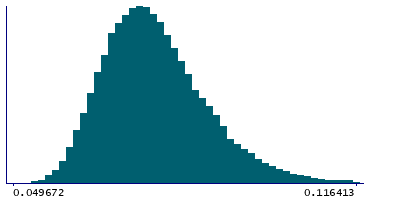
Data
83,906 items of data are available, covering 79,379 participants.
Defined-instances run from 2 to 3, labelled using Instancing
2.
Units of measurement are AU.
| Maximum | 0.580172 |
| Decile 9 | 0.091315 |
| Decile 8 | 0.0855625 |
| Decile 7 | 0.081778 |
| Decile 6 | 0.078857 |
| Median | 0.076306 |
| Decile 4 | 0.073918 |
| Decile 3 | 0.071536 |
| Decile 2 | 0.0688985 |
| Decile 1 | 0.065593 |
| Minimum | 0.047195 |
|
|
- Mean = 0.0778998
- Std.dev = 0.0135018
- 461 items above graph maximum of 0.117037
|
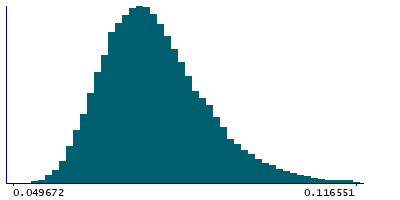
2 Instances
Instance 2 : Imaging visit (2014+)
79,148 participants, 79,148 items
| Maximum | 0.580172 |
| Decile 9 | 0.091396 |
| Decile 8 | 0.0856215 |
| Decile 7 | 0.0818175 |
| Decile 6 | 0.078892 |
| Median | 0.076333 |
| Decile 4 | 0.07395 |
| Decile 3 | 0.071564 |
| Decile 2 | 0.068928 |
| Decile 1 | 0.0656075 |
| Minimum | 0.047195 |
|
|
- Mean = 0.0779371
- Std.dev = 0.0134182
- 436 items above graph maximum of 0.117185
|
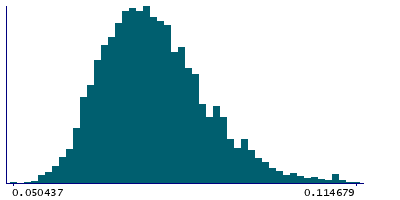
Instance 3 : First repeat imaging visit (2019+)
4,758 participants, 4,758 items
| Maximum | 0.533966 |
| Decile 9 | 0.0899265 |
| Decile 8 | 0.0845605 |
| Decile 7 | 0.0812395 |
| Decile 6 | 0.0783845 |
| Median | 0.075846 |
| Decile 4 | 0.073454 |
| Decile 3 | 0.07114 |
| Decile 2 | 0.068398 |
| Decile 1 | 0.065166 |
| Minimum | 0.050437 |
|
|
- Mean = 0.0772801
- Std.dev = 0.014809
- 20 items above graph maximum of 0.114687
|
Notes
Mean OD (orientation dispersion index) in cingulum cingulate gyrus (left) on FA (fractional anisotropy) skeleton (from dMRI data)
0 Related Data-Fields
There are no related data-fields
2 Applications
| Application ID | Title |
|---|
| 17689 | Genetic, environmental and lifestyle predictors of brain/cognitive-related outcomes. |
| 22783 | The joint analysis of imaging data and genetic data for early tumor detection, prevention, diagnosis and treatment |

