Data
83,906 items of data are available, covering 79,379 participants.
Defined-instances run from 2 to 3, labelled using Instancing
2.
Units of measurement are AU.
| Maximum | 0.970703 |
| Decile 9 | 0.17271 |
| Decile 8 | 0.165723 |
| Decile 7 | 0.160803 |
| Decile 6 | 0.156465 |
| Median | 0.152248 |
| Decile 4 | 0.147981 |
| Decile 3 | 0.143419 |
| Decile 2 | 0.137807 |
| Decile 1 | 0.130074 |
| Minimum | 0.070734 |
|

|
- Mean = 0.151816
- Std.dev = 0.0177452
- 35 items below graph minimum of 0.0874375
- 56 items above graph maximum of 0.215347
|
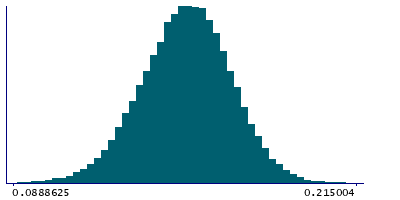
2 Instances
Instance 2 : Imaging visit (2014+)
79,148 participants, 79,148 items
| Maximum | 0.970703 |
| Decile 9 | 0.172677 |
| Decile 8 | 0.165675 |
| Decile 7 | 0.160716 |
| Decile 6 | 0.15639 |
| Median | 0.152172 |
| Decile 4 | 0.147918 |
| Decile 3 | 0.14333 |
| Decile 2 | 0.137713 |
| Decile 1 | 0.129961 |
| Minimum | 0.070734 |
|
|
- Mean = 0.151735
- Std.dev = 0.0177025
- 31 items below graph minimum of 0.0872455
- 50 items above graph maximum of 0.215392
|
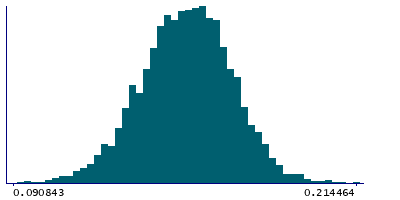
Instance 3 : First repeat imaging visit (2019+)
4,758 participants, 4,758 items
| Maximum | 0.682461 |
| Decile 9 | 0.173268 |
| Decile 8 | 0.166614 |
| Decile 7 | 0.16206 |
| Decile 6 | 0.157674 |
| Median | 0.153523 |
| Decile 4 | 0.149144 |
| Decile 3 | 0.144687 |
| Decile 2 | 0.13952 |
| Decile 1 | 0.132036 |
| Minimum | 0.082212 |
|
|
- Mean = 0.153154
- Std.dev = 0.0183899
- 4 items below graph minimum of 0.0908025
- 5 items above graph maximum of 0.214501
|
Notes
Mean OD (orientation dispersion index) in posterior corona radiata (left) on FA (fractional anisotropy) skeleton (from dMRI data)
0 Related Data-Fields
There are no related data-fields
2 Applications
| Application ID | Title |
|---|
| 17689 | Genetic, environmental and lifestyle predictors of brain/cognitive-related outcomes. |
| 22783 | The joint analysis of imaging data and genetic data for early tumor detection, prevention, diagnosis and treatment |

