Data
83,906 items of data are available, covering 79,379 participants.
Defined-instances run from 2 to 3, labelled using Instancing
2.
Units of measurement are AU.
| Maximum | 0.99 |
| Decile 9 | 0.584635 |
| Decile 8 | 0.567877 |
| Decile 7 | 0.555991 |
| Decile 6 | 0.545274 |
| Median | 0.535202 |
| Decile 4 | 0.52527 |
| Decile 3 | 0.514192 |
| Decile 2 | 0.501049 |
| Decile 1 | 0.481803 |
| Minimum | 0 |
|

|
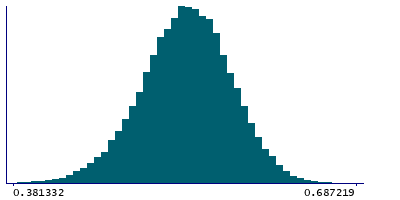
- Mean = 0.534006
- Std.dev = 0.0414296
- 98 items below graph minimum of 0.37897
- 27 items above graph maximum of 0.687468
|
2 Instances
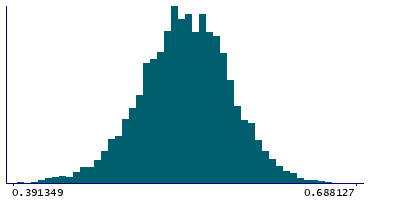
Instance 2 : Imaging visit (2014+)
79,148 participants, 79,148 items
| Maximum | 0.99 |
| Decile 9 | 0.584377 |
| Decile 8 | 0.567591 |
| Decile 7 | 0.555689 |
| Decile 6 | 0.544933 |
| Median | 0.534884 |
| Decile 4 | 0.5249 |
| Decile 3 | 0.513808 |
| Decile 2 | 0.500686 |
| Decile 1 | 0.481198 |
| Minimum | 0 |
|
|
- Mean = 0.533634
- Std.dev = 0.0415115
- 93 items below graph minimum of 0.378019
- 25 items above graph maximum of 0.687556
|
Instance 3 : First repeat imaging visit (2019+)
4,758 participants, 4,758 items
| Maximum | 0.915654 |
| Decile 9 | 0.589247 |
| Decile 8 | 0.572334 |
| Decile 7 | 0.561117 |
| Decile 6 | 0.551265 |
| Median | 0.540779 |
| Decile 4 | 0.531091 |
| Decile 3 | 0.52112 |
| Decile 2 | 0.507991 |
| Decile 1 | 0.490255 |
| Minimum | 0.374562 |
|
|
- Mean = 0.540184
- Std.dev = 0.0395338
- 2 items below graph minimum of 0.391263
- 2 items above graph maximum of 0.68824
|
Notes
Mean ICVF (intra-cellular volume fraction) in sagittal stratum (left) on FA (fractional anisotropy) skeleton (from dMRI data)
0 Related Data-Fields
There are no related data-fields
2 Applications
| Application ID | Title |
|---|
| 17689 | Genetic, environmental and lifestyle predictors of brain/cognitive-related outcomes. |
| 22783 | The joint analysis of imaging data and genetic data for early tumor detection, prevention, diagnosis and treatment |

