Data
83,906 items of data are available, covering 79,379 participants.
Defined-instances run from 2 to 3, labelled using Instancing
2.
Units of measurement are AU.
| Maximum | 0.98997 |
| Decile 9 | 0.741169 |
| Decile 8 | 0.72863 |
| Decile 7 | 0.719326 |
| Decile 6 | 0.711271 |
| Median | 0.703474 |
| Decile 4 | 0.695415 |
| Decile 3 | 0.686409 |
| Decile 2 | 0.675436 |
| Decile 1 | 0.65949 |
| Minimum | 0.479064 |
|
|
- Mean = 0.701522
- Std.dev = 0.033143
- 147 items below graph minimum of 0.577811
- 48 items above graph maximum of 0.822848
|
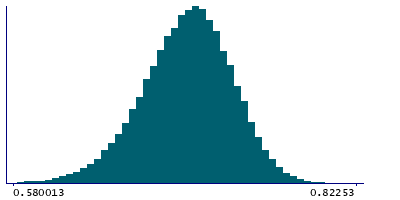
2 Instances
Instance 2 : Imaging visit (2014+)
79,148 participants, 79,148 items
| Maximum | 0.98997 |
| Decile 9 | 0.741107 |
| Decile 8 | 0.728498 |
| Decile 7 | 0.719178 |
| Decile 6 | 0.711104 |
| Median | 0.70332 |
| Decile 4 | 0.695223 |
| Decile 3 | 0.686222 |
| Decile 2 | 0.675171 |
| Decile 1 | 0.659182 |
| Minimum | 0.479064 |
|

|
- Mean = 0.701322
- Std.dev = 0.033237
- 139 items below graph minimum of 0.577257
- 45 items above graph maximum of 0.823032
|
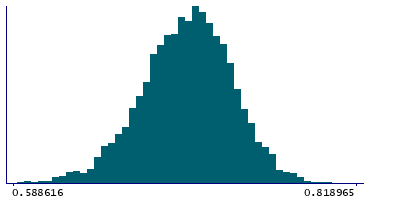
Instance 3 : First repeat imaging visit (2019+)
4,758 participants, 4,758 items
| Maximum | 0.966031 |
| Decile 9 | 0.742185 |
| Decile 8 | 0.730512 |
| Decile 7 | 0.721643 |
| Decile 6 | 0.713979 |
| Median | 0.706448 |
| Decile 4 | 0.698584 |
| Decile 3 | 0.689891 |
| Decile 2 | 0.680335 |
| Decile 1 | 0.665399 |
| Minimum | 0.494363 |
|
|
- Mean = 0.704839
- Std.dev = 0.0313528
- 8 items below graph minimum of 0.588612
- 3 items above graph maximum of 0.818971
|
Notes
Mean ICVF (intra-cellular volume fraction) in splenium of corpus callosum on FA (fractional anisotropy) skeleton (from dMRI data)
0 Related Data-Fields
There are no related data-fields
2 Applications
| Application ID | Title |
|---|
| 17689 | Genetic, environmental and lifestyle predictors of brain/cognitive-related outcomes. |
| 22783 | The joint analysis of imaging data and genetic data for early tumor detection, prevention, diagnosis and treatment |

