Data
83,911 items of data are available, covering 79,384 participants.
Defined-instances run from 2 to 3, labelled using Instancing
2.
Units of measurement are AU.
| Maximum | 0.001716 |
| Decile 9 | 0.000466 |
| Decile 8 | 0.000448 |
| Decile 7 | 0.000435 |
| Decile 6 | 0.000425 |
| Median | 0.000416 |
| Decile 4 | 0.000407 |
| Decile 3 | 0.000398 |
| Decile 2 | 0.000387 |
| Decile 1 | 0.000372 |
| Minimum | 0 |
|
|
- Mean = 0.000418253
- Std.dev = 3.92469e-05
- 20 items below graph minimum of 0.000278
- 201 items above graph maximum of 0.00056
|
2 Instances
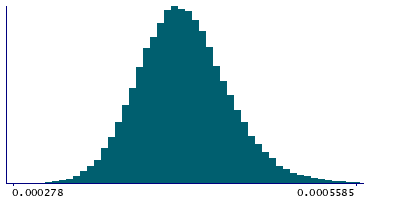
Instance 2 : Imaging visit (2014+)
79,153 participants, 79,153 items
| Maximum | 0.001716 |
| Decile 9 | 0.000467 |
| Decile 8 | 0.000448 |
| Decile 7 | 0.000436 |
| Decile 6 | 0.000426 |
| Median | 0.000416 |
| Decile 4 | 0.000408 |
| Decile 3 | 0.000398 |
| Decile 2 | 0.000387 |
| Decile 1 | 0.000372 |
| Minimum | 0 |
|

|
- Mean = 0.000418589
- Std.dev = 3.92729e-05
- 19 items below graph minimum of 0.000277
- 179 items above graph maximum of 0.000562
|
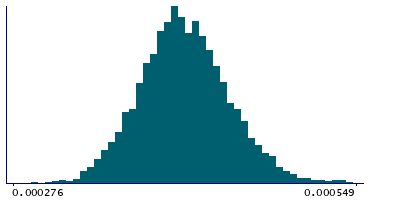
Instance 3 : First repeat imaging visit (2019+)
4,758 participants, 4,758 items
| Maximum | 0.000969 |
| Decile 9 | 0.000458 |
| Decile 8 | 0.000441 |
| Decile 7 | 0.000429 |
| Decile 6 | 0.00042 |
| Median | 0.000411 |
| Decile 4 | 0.000403 |
| Decile 3 | 0.000393 |
| Decile 2 | 0.000383 |
| Decile 1 | 0.000367 |
| Minimum | 0.000247 |
|
|
- Mean = 0.000412661
- Std.dev = 3.8383e-05
- 1 item below graph minimum of 0.000276
- 10 items above graph maximum of 0.000549
|
Notes
Mean L3 in uncinate fasciculus (right) on FA (fractional anisotropy) skeleton (from dMRI data)
0 Related Data-Fields
There are no related data-fields
2 Applications
| Application ID | Title |
|---|
| 17689 | Genetic, environmental and lifestyle predictors of brain/cognitive-related outcomes. |
| 22783 | The joint analysis of imaging data and genetic data for early tumor detection, prevention, diagnosis and treatment |

