Data
83,911 items of data are available, covering 79,384 participants.
Defined-instances run from 2 to 3, labelled using Instancing
2.
Units of measurement are AU.
| Maximum | 0.001849 |
| Decile 9 | 0.000417 |
| Decile 8 | 0.000399 |
| Decile 7 | 0.000389 |
| Decile 6 | 0.000381 |
| Median | 0.000374 |
| Decile 4 | 0.000367 |
| Decile 3 | 0.00036 |
| Decile 2 | 0.000353 |
| Decile 1 | 0.000342 |
| Minimum | 0 |
|

|
- Mean = 0.000378856
- Std.dev = 3.72077e-05
- 4 items below graph minimum of 0.000267
- 1161 items above graph maximum of 0.000492
|
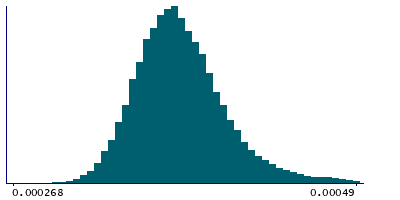
2 Instances
Instance 2 : Imaging visit (2014+)
79,153 participants, 79,153 items
| Maximum | 0.001849 |
| Decile 9 | 0.000417 |
| Decile 8 | 0.0004 |
| Decile 7 | 0.00039 |
| Decile 6 | 0.000381 |
| Median | 0.000374 |
| Decile 4 | 0.000368 |
| Decile 3 | 0.000361 |
| Decile 2 | 0.000353 |
| Decile 1 | 0.000343 |
| Minimum | 0 |
|
|
- Mean = 0.000379215
- Std.dev = 3.72927e-05
- 4 items below graph minimum of 0.000269
- 1123 items above graph maximum of 0.000491
|
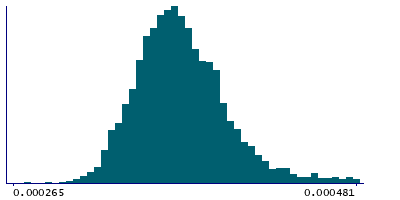
Instance 3 : First repeat imaging visit (2019+)
4,758 participants, 4,758 items
| Maximum | 0.00077 |
| Decile 9 | 0.000409 |
| Decile 8 | 0.000393 |
| Decile 7 | 0.000383 |
| Decile 6 | 0.000375 |
| Median | 0.000368 |
| Decile 4 | 0.000362 |
| Decile 3 | 0.000355 |
| Decile 2 | 0.0003475 |
| Decile 1 | 0.000337 |
| Minimum | 9.3e-05 |
|
|
- Mean = 0.000372888
- Std.dev = 3.5232e-05
- 1 item below graph minimum of 0.000265
- 70 items above graph maximum of 0.000481
|
Notes
Mean L3 in inferior cerebellar peduncle (left) on FA (fractional anisotropy) skeleton (from dMRI data)
0 Related Data-Fields
There are no related data-fields
2 Applications
| Application ID | Title |
|---|
| 17689 | Genetic, environmental and lifestyle predictors of brain/cognitive-related outcomes. |
| 22783 | The joint analysis of imaging data and genetic data for early tumor detection, prevention, diagnosis and treatment |

