Data
83,911 items of data are available, covering 79,384 participants.
Defined-instances run from 2 to 3, labelled using Instancing
2.
Units of measurement are AU.
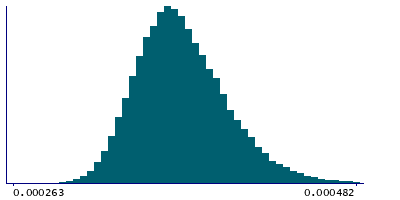
| Maximum | 0.001013 |
| Decile 9 | 0.000411 |
| Decile 8 | 0.000395 |
| Decile 7 | 0.000384 |
| Decile 6 | 0.000376 |
| Median | 0.000368 |
| Decile 4 | 0.000361 |
| Decile 3 | 0.000354 |
| Decile 2 | 0.000346 |
| Decile 1 | 0.000336 |
| Minimum | 0 |
|
|
- Mean = 0.000371591
- Std.dev = 3.09186e-05
- 4 items below graph minimum of 0.000261
- 225 items above graph maximum of 0.000486
|
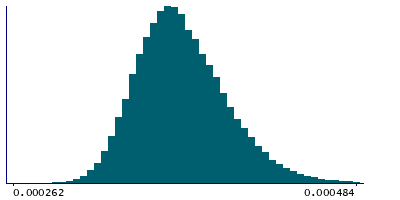
2 Instances
Instance 2 : Imaging visit (2014+)
79,153 participants, 79,153 items
| Maximum | 0.001013 |
| Decile 9 | 0.000411 |
| Decile 8 | 0.000395 |
| Decile 7 | 0.000385 |
| Decile 6 | 0.000376 |
| Median | 0.000369 |
| Decile 4 | 0.000362 |
| Decile 3 | 0.000355 |
| Decile 2 | 0.000347 |
| Decile 1 | 0.000336 |
| Minimum | 0 |
|
|
- Mean = 0.000371856
- Std.dev = 3.09673e-05
- 3 items below graph minimum of 0.000261
- 215 items above graph maximum of 0.000486
|
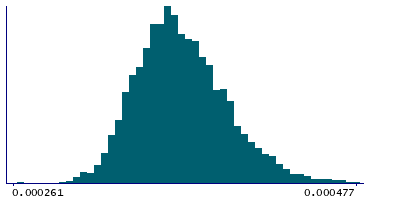
Instance 3 : First repeat imaging visit (2019+)
4,758 participants, 4,758 items
| Maximum | 0.000603 |
| Decile 9 | 0.000405 |
| Decile 8 | 0.00039 |
| Decile 7 | 0.00038 |
| Decile 6 | 0.000372 |
| Median | 0.000364 |
| Decile 4 | 0.000358 |
| Decile 3 | 0.000351 |
| Decile 2 | 0.000343 |
| Decile 1 | 0.000333 |
| Minimum | 0.000108 |
|
|
- Mean = 0.000367175
- Std.dev = 2.97512e-05
- 1 item below graph minimum of 0.000261
- 12 items above graph maximum of 0.000477
|
Notes
Mean L3 in middle cerebellar peduncle on FA (fractional anisotropy) skeleton (from dMRI data)
0 Related Data-Fields
There are no related data-fields
2 Applications
| Application ID | Title |
|---|
| 17689 | Genetic, environmental and lifestyle predictors of brain/cognitive-related outcomes. |
| 22783 | The joint analysis of imaging data and genetic data for early tumor detection, prevention, diagnosis and treatment |

