Data
83,911 items of data are available, covering 79,384 participants.
Defined-instances run from 2 to 3, labelled using Instancing
2.
Units of measurement are AU.
| Maximum | 0.002554 |
| Decile 9 | 0.001249 |
| Decile 8 | 0.001226 |
| Decile 7 | 0.00121 |
| Decile 6 | 0.001195 |
| Median | 0.001182 |
| Decile 4 | 0.001169 |
| Decile 3 | 0.001154 |
| Decile 2 | 0.001137 |
| Decile 1 | 0.001112 |
| Minimum | 0 |
|
|
- Mean = 0.00118149
- Std.dev = 5.5641e-05
- 34 items below graph minimum of 0.000975
- 54 items above graph maximum of 0.001386
|
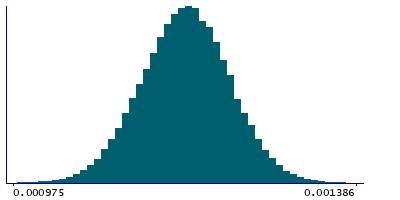
2 Instances
Instance 2 : Imaging visit (2014+)
79,153 participants, 79,153 items
| Maximum | 0.002554 |
| Decile 9 | 0.00125 |
| Decile 8 | 0.001227 |
| Decile 7 | 0.00121 |
| Decile 6 | 0.001196 |
| Median | 0.001182 |
| Decile 4 | 0.001169 |
| Decile 3 | 0.001155 |
| Decile 2 | 0.001137 |
| Decile 1 | 0.001113 |
| Minimum | 0 |
|

|
- Mean = 0.00118202
- Std.dev = 5.56537e-05
- 32 items below graph minimum of 0.000976
- 49 items above graph maximum of 0.001387
|
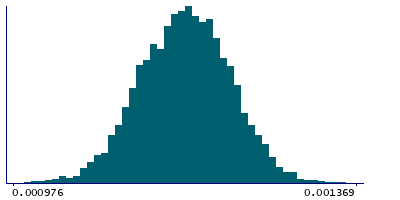
Instance 3 : First repeat imaging visit (2019+)
4,758 participants, 4,758 items
| Maximum | 0.002336 |
| Decile 9 | 0.001238 |
| Decile 8 | 0.001216 |
| Decile 7 | 0.0012 |
| Decile 6 | 0.001186 |
| Median | 0.001173 |
| Decile 4 | 0.00116 |
| Decile 3 | 0.001145 |
| Decile 2 | 0.001128 |
| Decile 1 | 0.001107 |
| Minimum | 0.000897 |
|
|
- Mean = 0.00117263
- Std.dev = 5.46729e-05
- 2 items below graph minimum of 0.000976
- 2 items above graph maximum of 0.001369
|
Notes
Mean L1 in cingulum hippocampus (right) on FA (fractional anisotropy) skeleton (from dMRI data)
0 Related Data-Fields
There are no related data-fields
2 Applications
| Application ID | Title |
|---|
| 17689 | Genetic, environmental and lifestyle predictors of brain/cognitive-related outcomes. |
| 22783 | The joint analysis of imaging data and genetic data for early tumor detection, prevention, diagnosis and treatment |

