Data
83,911 items of data are available, covering 79,384 participants.
Defined-instances run from 2 to 3, labelled using Instancing
2.
Units of measurement are AU.
| Maximum | 0.002715 |
| Decile 9 | 0.00158 |
| Decile 8 | 0.00155 |
| Decile 7 | 0.00153 |
| Decile 6 | 0.001513 |
| Median | 0.001497 |
| Decile 4 | 0.001482 |
| Decile 3 | 0.001466 |
| Decile 2 | 0.001448 |
| Decile 1 | 0.001421 |
| Minimum | 0 |
|

|
- Mean = 0.00149965
- Std.dev = 6.59431e-05
- 54 items below graph minimum of 0.001262
- 173 items above graph maximum of 0.001739
|
2 Instances
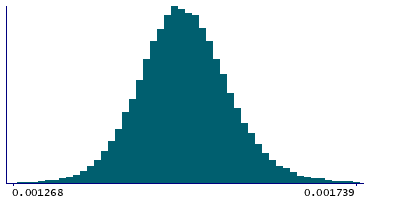
Instance 2 : Imaging visit (2014+)
79,153 participants, 79,153 items
| Maximum | 0.002715 |
| Decile 9 | 0.001581 |
| Decile 8 | 0.001551 |
| Decile 7 | 0.00153 |
| Decile 6 | 0.001514 |
| Median | 0.001498 |
| Decile 4 | 0.001483 |
| Decile 3 | 0.001467 |
| Decile 2 | 0.001449 |
| Decile 1 | 0.001422 |
| Minimum | 0 |
|
|
- Mean = 0.00150042
- Std.dev = 6.62119e-05
- 56 items below graph minimum of 0.001263
- 169 items above graph maximum of 0.00174
|
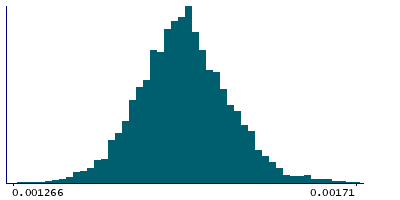
Instance 3 : First repeat imaging visit (2019+)
4,758 participants, 4,758 items
| Maximum | 0.001762 |
| Decile 9 | 0.001562 |
| Decile 8 | 0.0015335 |
| Decile 7 | 0.001514 |
| Decile 6 | 0.001498 |
| Median | 0.001485 |
| Decile 4 | 0.001472 |
| Decile 3 | 0.001457 |
| Decile 2 | 0.0014395 |
| Decile 1 | 0.001414 |
| Minimum | 0.001214 |
|
|
- Mean = 0.00148683
- Std.dev = 5.98613e-05
- 1 item below graph minimum of 0.001266
- 9 items above graph maximum of 0.00171
|
Notes
Mean L1 in posterior thalamic radiation (left) on FA (fractional anisotropy) skeleton (from dMRI data)
0 Related Data-Fields
There are no related data-fields
2 Applications
| Application ID | Title |
|---|
| 17689 | Genetic, environmental and lifestyle predictors of brain/cognitive-related outcomes. |
| 22783 | The joint analysis of imaging data and genetic data for early tumor detection, prevention, diagnosis and treatment |

