Data
83,911 items of data are available, covering 79,384 participants.
Defined-instances run from 2 to 3, labelled using Instancing
2.
Units of measurement are AU.
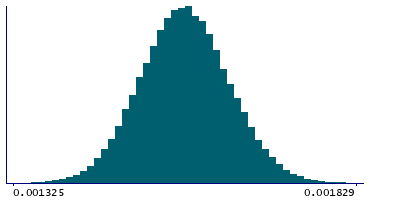
| Maximum | 0.001901 |
| Decile 9 | 0.00166 |
| Decile 8 | 0.001631 |
| Decile 7 | 0.00161 |
| Decile 6 | 0.001592 |
| Median | 0.001576 |
| Decile 4 | 0.00156 |
| Decile 3 | 0.001543 |
| Decile 2 | 0.001523 |
| Decile 1 | 0.001494 |
| Minimum | 0 |
|
|
- Mean = 0.00157645
- Std.dev = 6.65625e-05
- 87 items below graph minimum of 0.001328
- 18 items above graph maximum of 0.001826
|
2 Instances
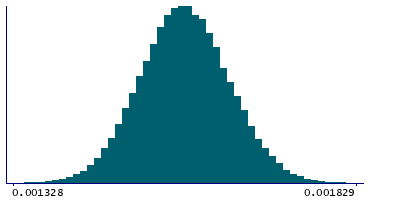
Instance 2 : Imaging visit (2014+)
79,153 participants, 79,153 items
| Maximum | 0.001901 |
| Decile 9 | 0.001661 |
| Decile 8 | 0.001632 |
| Decile 7 | 0.001611 |
| Decile 6 | 0.001594 |
| Median | 0.001577 |
| Decile 4 | 0.001561 |
| Decile 3 | 0.001544 |
| Decile 2 | 0.001524 |
| Decile 1 | 0.001495 |
| Minimum | 0 |
|
|
- Mean = 0.0015776
- Std.dev = 6.66194e-05
- 83 items below graph minimum of 0.001329
- 17 items above graph maximum of 0.001827
|
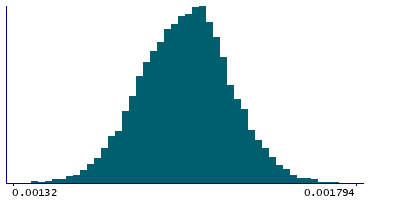
Instance 3 : First repeat imaging visit (2019+)
4,758 participants, 4,758 items
| Maximum | 0.001853 |
| Decile 9 | 0.001636 |
| Decile 8 | 0.001608 |
| Decile 7 | 0.00159 |
| Decile 6 | 0.001575 |
| Median | 0.001559 |
| Decile 4 | 0.001543 |
| Decile 3 | 0.001525 |
| Decile 2 | 0.001505 |
| Decile 1 | 0.001478 |
| Minimum | 0.001184 |
|
|
- Mean = 0.00155722
- Std.dev = 6.25504e-05
- 4 items below graph minimum of 0.00132
- 1 item above graph maximum of 0.001794
|
Notes
Mean L1 in superior cerebellar peduncle (right) on FA (fractional anisotropy) skeleton (from dMRI data)
0 Related Data-Fields
There are no related data-fields
2 Applications
| Application ID | Title |
|---|
| 17689 | Genetic, environmental and lifestyle predictors of brain/cognitive-related outcomes. |
| 22783 | The joint analysis of imaging data and genetic data for early tumor detection, prevention, diagnosis and treatment |

