Data
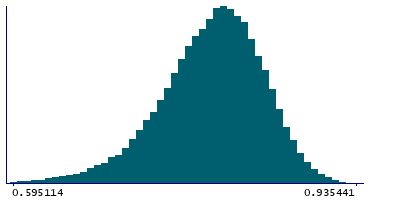
83,911 items of data are available, covering 79,384 participants.
Defined-instances run from 2 to 3, labelled using Instancing
2.
Units of measurement are AU.
| Maximum | 0.935441 |
| Decile 9 | 0.853416 |
| Decile 8 | 0.835441 |
| Decile 7 | 0.821991 |
| Decile 6 | 0.809561 |
| Median | 0.797575 |
| Decile 4 | 0.784922 |
| Decile 3 | 0.770338 |
| Decile 2 | 0.752553 |
| Decile 1 | 0.725073 |
| Minimum | -0.04936 |
|
|
- Mean = 0.791878
- Std.dev = 0.0542285
- 344 items below graph minimum of 0.596729
|
2 Instances
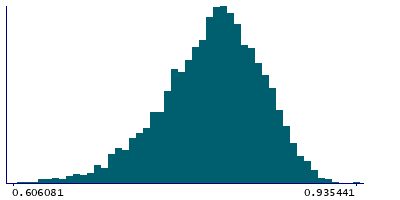
Instance 2 : Imaging visit (2014+)
79,153 participants, 79,153 items
| Maximum | 0.935123 |
| Decile 9 | 0.853342 |
| Decile 8 | 0.835319 |
| Decile 7 | 0.821913 |
| Decile 6 | 0.809444 |
| Median | 0.797384 |
| Decile 4 | 0.78468 |
| Decile 3 | 0.770123 |
| Decile 2 | 0.752231 |
| Decile 1 | 0.72474 |
| Minimum | -0.04936 |
|

|
- Mean = 0.791708
- Std.dev = 0.0542839
- 315 items below graph minimum of 0.596137
|
Instance 3 : First repeat imaging visit (2019+)
4,758 participants, 4,758 items
| Maximum | 0.935441 |
| Decile 9 | 0.854437 |
| Decile 8 | 0.837088 |
| Decile 7 | 0.82327 |
| Decile 6 | 0.811452 |
| Median | 0.800468 |
| Decile 4 | 0.788415 |
| Decile 3 | 0.774408 |
| Decile 2 | 0.757116 |
| Decile 1 | 0.730261 |
| Minimum | 0.159683 |
|
|
- Mean = 0.794714
- Std.dev = 0.0532189
- 23 items below graph minimum of 0.606085
|
Notes
Mean MO (diffusion tensor mode) in medial lemniscus (left) on FA (fractional anisotropy) skeleton (from dMRI data)
0 Related Data-Fields
There are no related data-fields
2 Applications
| Application ID | Title |
|---|
| 17689 | Genetic, environmental and lifestyle predictors of brain/cognitive-related outcomes. |
| 22783 | The joint analysis of imaging data and genetic data for early tumor detection, prevention, diagnosis and treatment |

