Data
83,911 items of data are available, covering 79,384 participants.
Defined-instances run from 2 to 3, labelled using Instancing
2.
Units of measurement are AU.
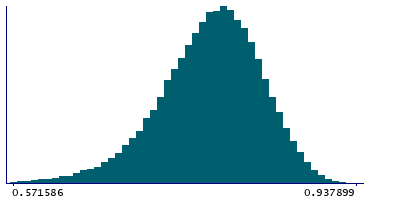
| Maximum | 0.939167 |
| Decile 9 | 0.848499 |
| Decile 8 | 0.828773 |
| Decile 7 | 0.81373 |
| Decile 6 | 0.800237 |
| Median | 0.787454 |
| Decile 4 | 0.773812 |
| Decile 3 | 0.758462 |
| Decile 2 | 0.73938 |
| Decile 1 | 0.710679 |
| Minimum | -0.173362 |
|
|
- Mean = 0.781858
- Std.dev = 0.0576356
- 327 items below graph minimum of 0.572859
|
2 Instances
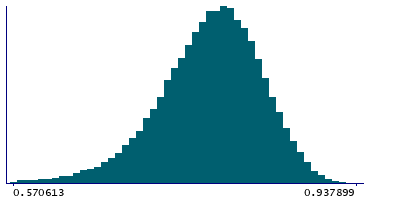
Instance 2 : Imaging visit (2014+)
79,153 participants, 79,153 items
| Maximum | 0.939167 |
| Decile 9 | 0.848421 |
| Decile 8 | 0.828675 |
| Decile 7 | 0.813565 |
| Decile 6 | 0.80008 |
| Median | 0.787272 |
| Decile 4 | 0.773564 |
| Decile 3 | 0.758171 |
| Decile 2 | 0.739046 |
| Decile 1 | 0.710261 |
| Minimum | -0.173362 |
|
|
- Mean = 0.781657
- Std.dev = 0.0577192
- 307 items below graph minimum of 0.572101
|
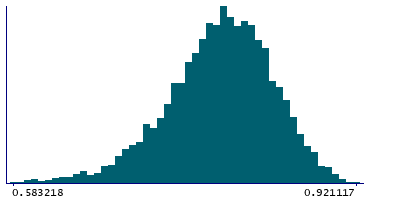
Instance 3 : First repeat imaging visit (2019+)
4,758 participants, 4,758 items
| Maximum | 0.921117 |
| Decile 9 | 0.849487 |
| Decile 8 | 0.830072 |
| Decile 7 | 0.815997 |
| Decile 6 | 0.803055 |
| Median | 0.790375 |
| Decile 4 | 0.777431 |
| Decile 3 | 0.763348 |
| Decile 2 | 0.744749 |
| Decile 1 | 0.71639 |
| Minimum | 0.179975 |
|
|
- Mean = 0.785211
- Std.dev = 0.0561198
- 23 items below graph minimum of 0.583292
|
Notes
Mean MO (diffusion tensor mode) in medial lemniscus (right) on FA (fractional anisotropy) skeleton (from dMRI data)
0 Related Data-Fields
There are no related data-fields
2 Applications
| Application ID | Title |
|---|
| 17689 | Genetic, environmental and lifestyle predictors of brain/cognitive-related outcomes. |
| 22783 | The joint analysis of imaging data and genetic data for early tumor detection, prevention, diagnosis and treatment |

