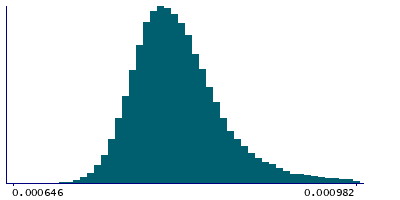
Data
83,911 items of data are available, covering 79,384 participants.
Defined-instances run from 2 to 3, labelled using Instancing
2.
Units of measurement are AU.
| Maximum | 0.002977 |
| Decile 9 | 0.000877 |
| Decile 8 | 0.000845 |
| Decile 7 | 0.000827 |
| Decile 6 | 0.000815 |
| Median | 0.000804 |
| Decile 4 | 0.000793 |
| Decile 3 | 0.000783 |
| Decile 2 | 0.000772 |
| Decile 1 | 0.000758 |
| Minimum | 0.000415 |
|
|
- Mean = 0.000813941
- Std.dev = 5.94903e-05
- 5 items below graph minimum of 0.000639
- 1376 items above graph maximum of 0.000996
|
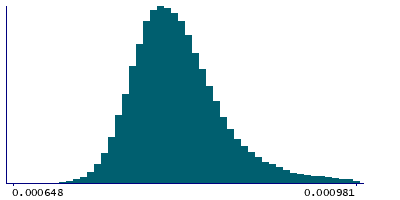
2 Instances
Instance 2 : Imaging visit (2014+)
79,153 participants, 79,153 items
| Maximum | 0.002977 |
| Decile 9 | 0.000878 |
| Decile 8 | 0.000845 |
| Decile 7 | 0.000828 |
| Decile 6 | 0.000815 |
| Median | 0.000804 |
| Decile 4 | 0.000794 |
| Decile 3 | 0.000783 |
| Decile 2 | 0.000772 |
| Decile 1 | 0.000758 |
| Minimum | 0.000415 |
|
|
- Mean = 0.00081439
- Std.dev = 5.98729e-05
- 5 items below graph minimum of 0.000638
- 1282 items above graph maximum of 0.000998
|
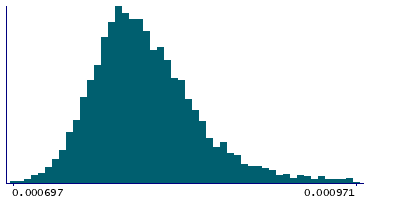
Instance 3 : First repeat imaging visit (2019+)
4,758 participants, 4,758 items
| Maximum | 0.001292 |
| Decile 9 | 0.000863 |
| Decile 8 | 0.000836 |
| Decile 7 | 0.00082 |
| Decile 6 | 0.000808 |
| Median | 0.000798 |
| Decile 4 | 0.000788 |
| Decile 3 | 0.000779 |
| Decile 2 | 0.000769 |
| Decile 1 | 0.000755 |
| Minimum | 0.000697 |
|
|
- Mean = 0.000806482
- Std.dev = 5.21579e-05
- 77 items above graph maximum of 0.000971
|
Notes
Mean MD (mean diffusivity) in posterior corona radiata (left) on FA (fractional anisotropy) skeleton (from dMRI data)
0 Related Data-Fields
There are no related data-fields
2 Applications
| Application ID | Title |
|---|
| 17689 | Genetic, environmental and lifestyle predictors of brain/cognitive-related outcomes. |
| 22783 | The joint analysis of imaging data and genetic data for early tumor detection, prevention, diagnosis and treatment |

