Data
83,911 items of data are available, covering 79,384 participants.
Defined-instances run from 2 to 3, labelled using Instancing
2.
Units of measurement are AU.
| Maximum | 0.747532 |
| Decile 9 | 0.570433 |
| Decile 8 | 0.554512 |
| Decile 7 | 0.543219 |
| Decile 6 | 0.533063 |
| Median | 0.523606 |
| Decile 4 | 0.514344 |
| Decile 3 | 0.504167 |
| Decile 2 | 0.492127 |
| Decile 1 | 0.474719 |
| Minimum | 0 |
|
|
- Mean = 0.522931
- Std.dev = 0.0380131
- 87 items below graph minimum of 0.379005
- 8 items above graph maximum of 0.666147
|
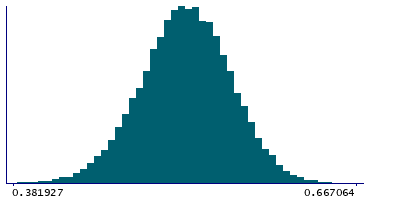
2 Instances
Instance 2 : Imaging visit (2014+)
79,153 participants, 79,153 items
| Maximum | 0.747532 |
| Decile 9 | 0.570274 |
| Decile 8 | 0.554387 |
| Decile 7 | 0.543081 |
| Decile 6 | 0.532894 |
| Median | 0.523442 |
| Decile 4 | 0.514176 |
| Decile 3 | 0.504035 |
| Decile 2 | 0.491963 |
| Decile 1 | 0.474513 |
| Minimum | 0 |
|

|
- Mean = 0.522772
- Std.dev = 0.0380391
- 82 items below graph minimum of 0.378751
- 7 items above graph maximum of 0.666035
|
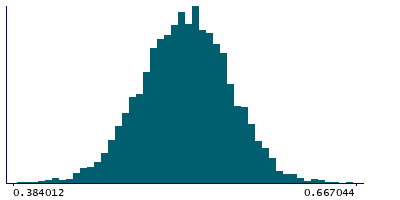
Instance 3 : First repeat imaging visit (2019+)
4,758 participants, 4,758 items
| Maximum | 0.680876 |
| Decile 9 | 0.572728 |
| Decile 8 | 0.556669 |
| Decile 7 | 0.54551 |
| Decile 6 | 0.535384 |
| Median | 0.526247 |
| Decile 4 | 0.517194 |
| Decile 3 | 0.506692 |
| Decile 2 | 0.495085 |
| Decile 1 | 0.478344 |
| Minimum | 0.256244 |
|
|
- Mean = 0.525591
- Std.dev = 0.0374787
- 7 items below graph minimum of 0.38396
- 1 item above graph maximum of 0.667111
|
Notes
Mean FA (fractional anisotropy) in uncinate fasciculus (right) on FA skeleton (from dMRI data)
0 Related Data-Fields
There are no related data-fields
2 Applications
| Application ID | Title |
|---|
| 17689 | Genetic, environmental and lifestyle predictors of brain/cognitive-related outcomes. |
| 22783 | The joint analysis of imaging data and genetic data for early tumor detection, prevention, diagnosis and treatment |

