Data
83,911 items of data are available, covering 79,384 participants.
Defined-instances run from 2 to 3, labelled using Instancing
2.
Units of measurement are AU.
| Maximum | 0.645566 |
| Decile 9 | 0.561926 |
| Decile 8 | 0.547952 |
| Decile 7 | 0.537491 |
| Decile 6 | 0.528253 |
| Median | 0.519437 |
| Decile 4 | 0.510213 |
| Decile 3 | 0.50002 |
| Decile 2 | 0.487891 |
| Decile 1 | 0.469322 |
| Minimum | 0 |
|
|
- Mean = 0.516989
- Std.dev = 0.0370675
- 145 items below graph minimum of 0.376717
|
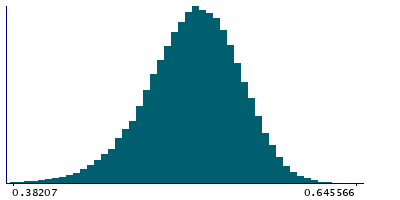
2 Instances
Instance 2 : Imaging visit (2014+)
79,153 participants, 79,153 items
| Maximum | 0.645566 |
| Decile 9 | 0.56167 |
| Decile 8 | 0.54761 |
| Decile 7 | 0.537162 |
| Decile 6 | 0.527901 |
| Median | 0.519059 |
| Decile 4 | 0.509784 |
| Decile 3 | 0.499597 |
| Decile 2 | 0.48735 |
| Decile 1 | 0.468817 |
| Minimum | 0 |
|

|
- Mean = 0.516605
- Std.dev = 0.0371565
- 135 items below graph minimum of 0.375964
|
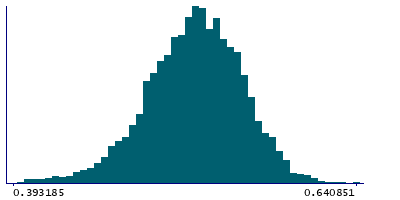
Instance 3 : First repeat imaging visit (2019+)
4,758 participants, 4,758 items
| Maximum | 0.640851 |
| Decile 9 | 0.565592 |
| Decile 8 | 0.552595 |
| Decile 7 | 0.542505 |
| Decile 6 | 0.533507 |
| Median | 0.525153 |
| Decile 4 | 0.516896 |
| Decile 3 | 0.507148 |
| Decile 2 | 0.495728 |
| Decile 1 | 0.479335 |
| Minimum | 0.308458 |
|
|
- Mean = 0.523375
- Std.dev = 0.0349409
- 8 items below graph minimum of 0.393078
|
Notes
Mean FA (fractional anisotropy) in fornix cres+stria terminalis (right) on FA skeleton (from dMRI data)
0 Related Data-Fields
There are no related data-fields
2 Applications
| Application ID | Title |
|---|
| 17689 | Genetic, environmental and lifestyle predictors of brain/cognitive-related outcomes. |
| 22783 | The joint analysis of imaging data and genetic data for early tumor detection, prevention, diagnosis and treatment |

