Data
83,911 items of data are available, covering 79,384 participants.
Defined-instances run from 2 to 3, labelled using Instancing
2.
Units of measurement are AU.
| Maximum | 0.756103 |
| Decile 9 | 0.629536 |
| Decile 8 | 0.618887 |
| Decile 7 | 0.611156 |
| Decile 6 | 0.604451 |
| Median | 0.597846 |
| Decile 4 | 0.591306 |
| Decile 3 | 0.583849 |
| Decile 2 | 0.574844 |
| Decile 1 | 0.561505 |
| Minimum | 0 |
|
|
- Mean = 0.596164
- Std.dev = 0.0283762
- 289 items below graph minimum of 0.493475
- 6 items above graph maximum of 0.697566
|
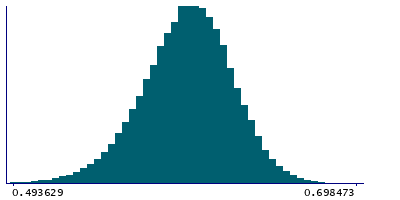
2 Instances
Instance 2 : Imaging visit (2014+)
79,153 participants, 79,153 items
| Maximum | 0.716805 |
| Decile 9 | 0.629222 |
| Decile 8 | 0.618636 |
| Decile 7 | 0.610872 |
| Decile 6 | 0.604163 |
| Median | 0.597554 |
| Decile 4 | 0.591025 |
| Decile 3 | 0.583545 |
| Decile 2 | 0.574514 |
| Decile 1 | 0.561071 |
| Minimum | 0 |
|

|
- Mean = 0.595865
- Std.dev = 0.0284223
- 270 items below graph minimum of 0.49292
- 5 items above graph maximum of 0.697373
|
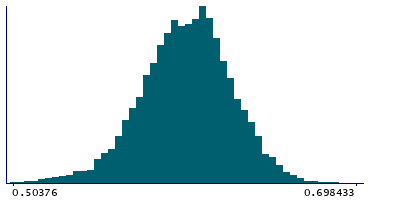
Instance 3 : First repeat imaging visit (2019+)
4,758 participants, 4,758 items
| Maximum | 0.756103 |
| Decile 9 | 0.633562 |
| Decile 8 | 0.622648 |
| Decile 7 | 0.615371 |
| Decile 6 | 0.609339 |
| Median | 0.602722 |
| Decile 4 | 0.595924 |
| Decile 3 | 0.589043 |
| Decile 2 | 0.580717 |
| Decile 1 | 0.568651 |
| Minimum | 0.373385 |
|
|
- Mean = 0.60115
- Std.dev = 0.0271161
- 19 items below graph minimum of 0.50374
- 1 item above graph maximum of 0.698473
|
Notes
Mean FA (fractional anisotropy) in medial lemniscus (right) on FA skeleton (from dMRI data)
0 Related Data-Fields
There are no related data-fields
2 Applications
| Application ID | Title |
|---|
| 17689 | Genetic, environmental and lifestyle predictors of brain/cognitive-related outcomes. |
| 22783 | The joint analysis of imaging data and genetic data for early tumor detection, prevention, diagnosis and treatment |

