Data
70,320 items of data are available, covering 66,459 participants.
Defined-instances run from 2 to 3, labelled using Instancing
2.
Units of measurement are percent.
| Maximum | 6.722 |
| Decile 9 | 1.06 |
| Decile 8 | 0.914 |
| Decile 7 | 0.815 |
| Decile 6 | 0.732 |
| Median | 0.656 |
| Decile 4 | 0.581 |
| Decile 3 | 0.5 |
| Decile 2 | 0.4 |
| Decile 1 | 0.24 |
| Minimum | -21.78 |
|
|
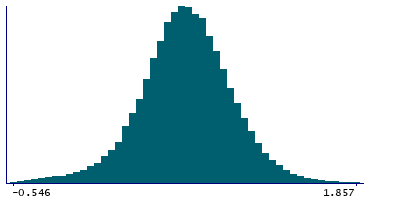
- Mean = 0.644752
- Std.dev = 0.381692
- 409 items below graph minimum of -0.58
- 84 items above graph maximum of 1.88
|
2 Instances
Instance 2 : Imaging visit (2014+)
66,036 participants, 66,036 items
| Maximum | 6.722 |
| Decile 9 | 1.062 |
| Decile 8 | 0.916 |
| Decile 7 | 0.817 |
| Decile 6 | 0.734 |
| Median | 0.658 |
| Decile 4 | 0.582 |
| Decile 3 | 0.5 |
| Decile 2 | 0.399 |
| Decile 1 | 0.239 |
| Minimum | -21.78 |
|
|
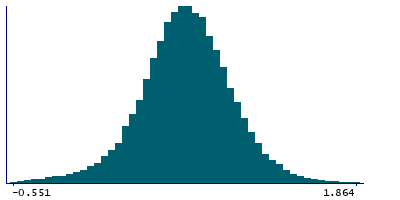
- Mean = 0.645485
- Std.dev = 0.384817
- 388 items below graph minimum of -0.584
- 80 items above graph maximum of 1.885
|
Instance 3 : First repeat imaging visit (2019+)
4,284 participants, 4,284 items
| Maximum | 4.366 |
| Decile 9 | 1.018 |
| Decile 8 | 0.8755 |
| Decile 7 | 0.782 |
| Decile 6 | 0.7035 |
| Median | 0.633 |
| Decile 4 | 0.566 |
| Decile 3 | 0.492 |
| Decile 2 | 0.403 |
| Decile 1 | 0.261 |
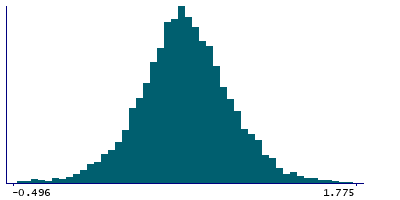
| Minimum | -1.87 |
|
|
- Mean = 0.633454
- Std.dev = 0.329588
- 23 items below graph minimum of -0.496
- 9 items above graph maximum of 1.775
|