Data
70,320 items of data are available, covering 66,459 participants.
Defined-instances run from 2 to 3, labelled using Instancing
2.
Units of measurement are Z.
| Maximum | 62.41 |
| Decile 9 | 4.172 |
| Decile 8 | 3.601 |
| Decile 7 | 3.18 |
| Decile 6 | 2.828 |
| Median | 2.501 |
| Decile 4 | 2.161 |
| Decile 3 | 1.794 |
| Decile 2 | 1.36 |
| Decile 1 | 0.7234 |
| Minimum | -4.709 |
|

|
- Mean = 2.4604
- Std.dev = 1.38418
- 44 items below graph minimum of -2.7252
- 3 items above graph maximum of 7.6206
|
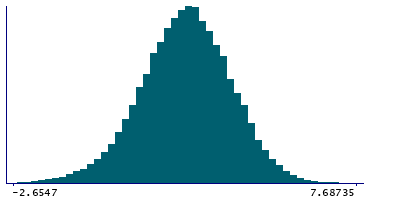
2 Instances
Instance 2 : Imaging visit (2014+)
66,036 participants, 66,036 items
| Maximum | 62.41 |
| Decile 9 | 4.171 |
| Decile 8 | 3.599 |
| Decile 7 | 3.177 |
| Decile 6 | 2.823 |
| Median | 2.495 |
| Decile 4 | 2.154 |
| Decile 3 | 1.787 |
| Decile 2 | 1.354 |
| Decile 1 | 0.7168 |
| Minimum | -4.709 |
|
|
- Mean = 2.45548
- Std.dev = 1.38732
- 42 items below graph minimum of -2.7374
- 3 items above graph maximum of 7.6252
|
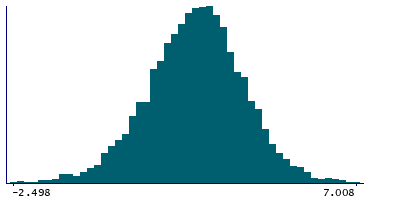
Instance 3 : First repeat imaging visit (2019+)
4,284 participants, 4,284 items
| Maximum | 7.008 |
| Decile 9 | 4.1895 |
| Decile 8 | 3.6185 |
| Decile 7 | 3.227 |
| Decile 6 | 2.8965 |
| Median | 2.579 |
| Decile 4 | 2.2555 |
| Decile 3 | 1.8995 |
| Decile 2 | 1.468 |
| Decile 1 | 0.84625 |
| Minimum | -2.888 |
|
|
- Mean = 2.53625
- Std.dev = 1.33254
- 1 item below graph minimum of -2.497
|