Data
78,625 items of data are available, covering 74,332 participants.
Defined-instances run from 2 to 3, labelled using Instancing
2.
Units of measurement are ms.
| Maximum | 59.889 |
| Decile 9 | 50.8305 |
| Decile 8 | 49.398 |
| Decile 7 | 48.4167 |
| Decile 6 | 47.5928 |
| Median | 46.831 |
| Decile 4 | 46.0689 |
| Decile 3 | 45.2113 |
| Decile 2 | 44.1723 |
| Decile 1 | 42.5741 |
| Minimum | 0 |
|
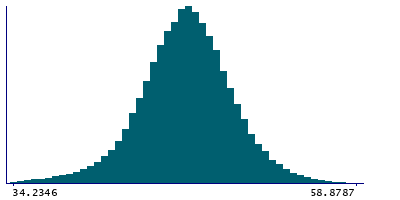
|
- Mean = 46.6915
- Std.dev = 3.50701
- 367 items below graph minimum of 34.3176
- 4 items above graph maximum of 59.087
|
2 Instances
Instance 2 : Imaging visit (2014+)
73,987 participants, 73,987 items
| Maximum | 59.889 |
| Decile 9 | 50.8496 |
| Decile 8 | 49.4181 |
| Decile 7 | 48.4345 |
| Decile 6 | 47.6109 |
| Median | 46.8476 |
| Decile 4 | 46.0838 |
| Decile 3 | 45.2223 |
| Decile 2 | 44.1813 |
| Decile 1 | 42.57 |
| Minimum | 0 |
|
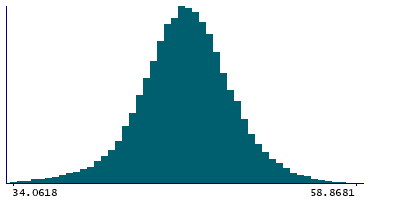
|
- Mean = 46.7046
- Std.dev = 3.51018
- 344 items below graph minimum of 34.2904
- 4 items above graph maximum of 59.1291
|
Instance 3 : First repeat imaging visit (2019+)
4,638 participants, 4,638 items
| Maximum | 57.9575 |
| Decile 9 | 50.4613 |
| Decile 8 | 49.0381 |
| Decile 7 | 48.1242 |
| Decile 6 | 47.3246 |
| Median | 46.5999 |
| Decile 4 | 45.8544 |
| Decile 3 | 45.0273 |
| Decile 2 | 44.0829 |
| Decile 1 | 42.6147 |
| Minimum | 0 |
|
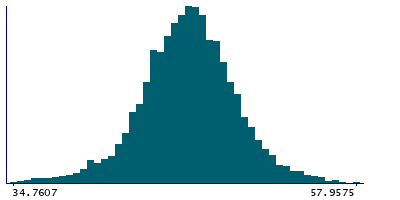
|
- Mean = 46.4821
- Std.dev = 3.44936
- 26 items below graph minimum of 34.7681
|
Notes
Median T2star in left thalamus (from SWI data)
0 Related Data-Fields
There are no related data-fields
2 Applications
| Application ID | Title |
|---|
| 17689 | Genetic, environmental and lifestyle predictors of brain/cognitive-related outcomes. |
| 22783 | The joint analysis of imaging data and genetic data for early tumor detection, prevention, diagnosis and treatment |


