Data
84,756 items of data are available, covering 80,210 participants.
Defined-instances run from 2 to 3, labelled using Instancing
2.
| Maximum | 1.99878 |
| Decile 9 | 0.856453 |
| Decile 8 | 0.797254 |
| Decile 7 | 0.760814 |
| Decile 6 | 0.73318 |
| Median | 0.710572 |
| Decile 4 | 0.690007 |
| Decile 3 | 0.66997 |
| Decile 2 | 0.64913 |
| Decile 1 | 0.624503 |
| Minimum | 0.270524 |
|

|
- Mean = 0.728786
- Std.dev = 0.0974172
- 1 item below graph minimum of 0.392553
- 461 items above graph maximum of 1.0884
|
2 Instances
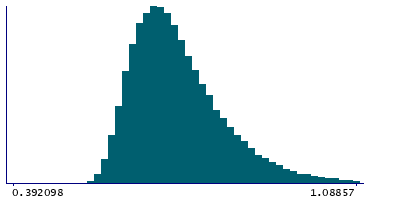
Instance 2 : Imaging visit (2014+)
80,001 participants, 80,001 items
| Maximum | 1.85904 |
| Decile 9 | 0.856908 |
| Decile 8 | 0.797685 |
| Decile 7 | 0.761237 |
| Decile 6 | 0.733527 |
| Median | 0.710926 |
| Decile 4 | 0.690293 |
| Decile 3 | 0.670273 |
| Decile 2 | 0.649369 |
| Decile 1 | 0.624488 |
| Minimum | 0.270524 |
|
|
- Mean = 0.729074
- Std.dev = 0.097426
- 1 item below graph minimum of 0.392068
- 430 items above graph maximum of 1.08933
|
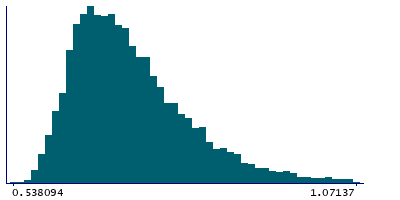
Instance 3 : First repeat imaging visit (2019+)
4,755 participants, 4,755 items
| Maximum | 1.99878 |
| Decile 9 | 0.848001 |
| Decile 8 | 0.79007 |
| Decile 7 | 0.75411 |
| Decile 6 | 0.726946 |
| Median | 0.704612 |
| Decile 4 | 0.684244 |
| Decile 3 | 0.664723 |
| Decile 2 | 0.64553 |
| Decile 1 | 0.624628 |
| Minimum | 0.538094 |
|
|
- Mean = 0.723938
- Std.dev = 0.0971411
- 32 items above graph maximum of 1.07137
|
Notes
90th percentile of the S variable from DVARS from the cleaned (after FIX) rfMRI
0 Related Data-Fields
There are no related data-fields


