Data
39,618 items of data are available, covering 37,214 participants.
Defined-instances run from 2 to 3, labelled using Instancing
2.
Units of measurement are g.
| Maximum | 1031.01 |
| Decile 9 | 653.876 |
| Decile 8 | 602.205 |
| Decile 7 | 558.886 |
| Decile 6 | 516.701 |
| Median | 472.534 |
| Decile 4 | 433.042 |
| Decile 3 | 401.143 |
| Decile 2 | 372.056 |
| Decile 1 | 338.171 |
| Minimum | 62.0598 |
|
|
- Mean = 486.692
- Std.dev = 121.834
- 1 item above graph maximum of 969.582
|
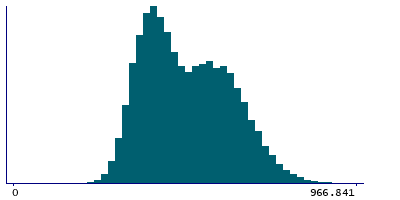
2 Instances
Instance 2 : Imaging visit (2014+)
35,837 participants, 35,837 items
| Maximum | 1031.01 |
| Decile 9 | 653.567 |
| Decile 8 | 602.061 |
| Decile 7 | 558.523 |
| Decile 6 | 516.287 |
| Median | 472.057 |
| Decile 4 | 432.752 |
| Decile 3 | 401.128 |
| Decile 2 | 372.232 |
| Decile 1 | 338.262 |
| Minimum | 62.0598 |
|

|
- Mean = 486.511
- Std.dev = 121.687
- 1 item above graph maximum of 968.871
|
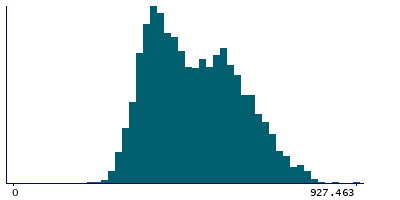
Instance 3 : First repeat imaging visit (2019+)
3,781 participants, 3,781 items
| Maximum | 927.463 |
| Decile 9 | 657.094 |
| Decile 8 | 603.538 |
| Decile 7 | 562.475 |
| Decile 6 | 520.679 |
| Median | 476.727 |
| Decile 4 | 436.116 |
| Decile 3 | 401.476 |
| Decile 2 | 370.931 |
| Decile 1 | 337.472 |
| Minimum | 196.898 |
|
|
- Mean = 488.407
- Std.dev = 123.2
|