Data
78,765 items of data are available, covering 72,674 participants.
Defined-instances run from 2 to 3, labelled using Instancing
2.
Units of measurement are cm2.
| Maximum | 3391.18 |
| Decile 9 | 468.637 |
| Decile 8 | 443.27 |
| Decile 7 | 422.502 |
| Decile 6 | 402.263 |
| Median | 380.075 |
| Decile 4 | 359.445 |
| Decile 3 | 342.234 |
| Decile 2 | 326.79 |
| Decile 1 | 308.628 |
| Minimum | 0 |
|

|
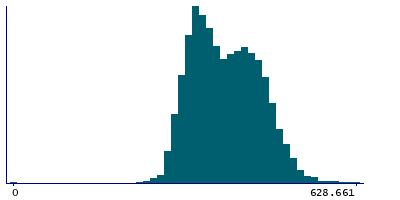
- Mean = 385.439
- Std.dev = 64.548
- 11 items above graph maximum of 628.646
|
2 Instances
Instance 2 : Imaging visit (2014+)
72,404 participants, 72,404 items
| Maximum | 3391.18 |
| Decile 9 | 468.446 |
| Decile 8 | 442.981 |
| Decile 7 | 422.138 |
| Decile 6 | 401.903 |
| Median | 379.646 |
| Decile 4 | 358.925 |
| Decile 3 | 341.914 |
| Decile 2 | 326.481 |
| Decile 1 | 308.398 |
| Minimum | 0 |
|

|
- Mean = 385.117
- Std.dev = 64.7104
- 8 items above graph maximum of 628.495
|
Instance 3 : First repeat imaging visit (2019+)
6,361 participants, 6,361 items
| Maximum | 667.003 |
| Decile 9 | 471.432 |
| Decile 8 | 447.115 |
| Decile 7 | 426.793 |
| Decile 6 | 406.706 |
| Median | 384.613 |
| Decile 4 | 364.304 |
| Decile 3 | 346.299 |
| Decile 2 | 330.124 |
| Decile 1 | 311.408 |
| Minimum | 0 |
|
|
- Mean = 389.103
- Std.dev = 62.5538
- 3 items above graph maximum of 631.456
|