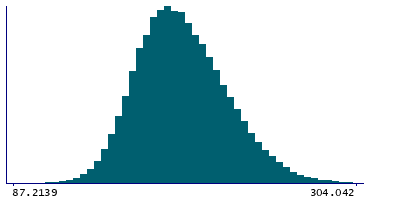
Data
78,765 items of data are available, covering 72,674 participants.
Defined-instances run from 2 to 3, labelled using Instancing
2.
Units of measurement are cm2.
| Maximum | 415.008 |
| Decile 9 | 231.022 |
| Decile 8 | 216.67 |
| Decile 7 | 206.629 |
| Decile 6 | 198.267 |
| Median | 190.866 |
| Decile 4 | 183.793 |
| Decile 3 | 176.728 |
| Decile 2 | 168.907 |
| Decile 1 | 158.492 |
| Minimum | 0 |
|
|
- Mean = 192.982
- Std.dev = 28.6855
- 23 items below graph minimum of 85.963
- 28 items above graph maximum of 303.551
|
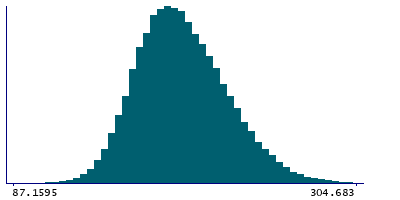
2 Instances
Instance 2 : Imaging visit (2014+)
72,404 participants, 72,404 items
| Maximum | 415.008 |
| Decile 9 | 231.302 |
| Decile 8 | 216.929 |
| Decile 7 | 206.913 |
| Decile 6 | 198.481 |
| Median | 191.074 |
| Decile 4 | 183.992 |
| Decile 3 | 176.89 |
| Decile 2 | 169.084 |
| Decile 1 | 158.611 |
| Minimum | 0 |
|
|
- Mean = 193.197
- Std.dev = 28.7564
- 22 items below graph minimum of 85.9188
- 27 items above graph maximum of 303.994
|
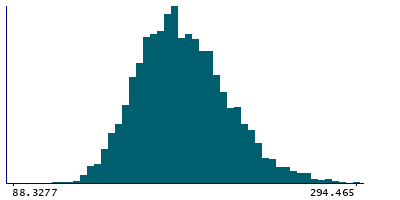
Instance 3 : First repeat imaging visit (2019+)
6,361 participants, 6,361 items
| Maximum | 305.298 |
| Decile 9 | 227.743 |
| Decile 8 | 213.521 |
| Decile 7 | 203.994 |
| Decile 6 | 195.743 |
| Median | 188.333 |
| Decile 4 | 181.558 |
| Decile 3 | 174.703 |
| Decile 2 | 167.032 |
| Decile 1 | 156.825 |
| Minimum | 0 |
|
|
- Mean = 190.532
- Std.dev = 27.7492
- 1 item below graph minimum of 85.9071
- 2 items above graph maximum of 298.661
|