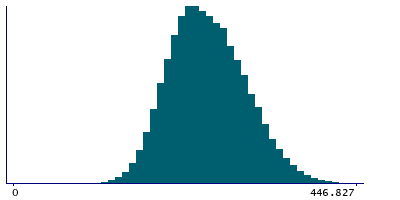
Data
78,765 items of data are available, covering 72,674 participants.
Defined-instances run from 2 to 3, labelled using Instancing
2.
Units of measurement are cm2.
| Maximum | 1501.9 |
| Decile 9 | 319.029 |
| Decile 8 | 295.2 |
| Decile 7 | 277.768 |
| Decile 6 | 263.018 |
| Median | 249.191 |
| Decile 4 | 235.986 |
| Decile 3 | 222.925 |
| Decile 2 | 208.764 |
| Decile 1 | 190.549 |
| Minimum | 0 |
|
|
- Mean = 252.324
- Std.dev = 50.3189
- 28 items above graph maximum of 447.509
|
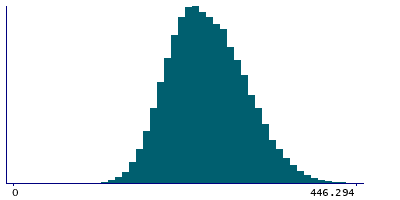
2 Instances
Instance 2 : Imaging visit (2014+)
72,404 participants, 72,404 items
| Maximum | 1501.9 |
| Decile 9 | 318.634 |
| Decile 8 | 294.73 |
| Decile 7 | 277.323 |
| Decile 6 | 262.511 |
| Median | 248.645 |
| Decile 4 | 235.423 |
| Decile 3 | 222.435 |
| Decile 2 | 208.348 |
| Decile 1 | 190.015 |
| Minimum | 0 |
|
|
- Mean = 251.856
- Std.dev = 50.3208
- 25 items above graph maximum of 447.252
|
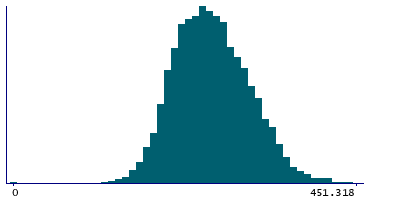
Instance 3 : First repeat imaging visit (2019+)
6,361 participants, 6,361 items
| Maximum | 544.484 |
| Decile 9 | 323.892 |
| Decile 8 | 300.298 |
| Decile 7 | 282.746 |
| Decile 6 | 268.288 |
| Median | 255.295 |
| Decile 4 | 241.86 |
| Decile 3 | 228.35 |
| Decile 2 | 213.772 |
| Decile 1 | 196.266 |
| Minimum | 0 |
|
|
- Mean = 257.655
- Std.dev = 49.9899
- 3 items above graph maximum of 451.517
|