Data
78,765 items of data are available, covering 72,674 participants.
Defined-instances run from 2 to 3, labelled using Instancing
2.
Units of measurement are cm2.
| Maximum | 800.36 |
| Decile 9 | 383.959 |
| Decile 8 | 364.668 |
| Decile 7 | 349.512 |
| Decile 6 | 335.801 |
| Median | 323.018 |
| Decile 4 | 310.488 |
| Decile 3 | 298.902 |
| Decile 2 | 286.7 |
| Decile 1 | 271.377 |
| Minimum | 0 |
|
|
- Mean = 325.595
- Std.dev = 43.585
- 11 items below graph minimum of 158.796
- 3 items above graph maximum of 496.541
|
2 Instances
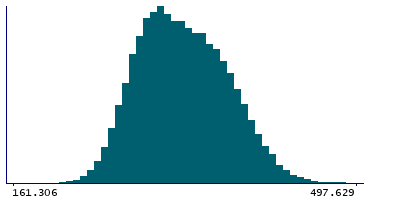
Instance 2 : Imaging visit (2014+)
72,404 participants, 72,404 items
| Maximum | 800.36 |
| Decile 9 | 383.83 |
| Decile 8 | 364.547 |
| Decile 7 | 349.315 |
| Decile 6 | 335.596 |
| Median | 322.861 |
| Decile 4 | 310.348 |
| Decile 3 | 298.811 |
| Decile 2 | 286.607 |
| Decile 1 | 271.318 |
| Minimum | 0 |
|

|
- Mean = 325.465
- Std.dev = 43.5559
- 10 items below graph minimum of 158.806
- 3 items above graph maximum of 496.342
|
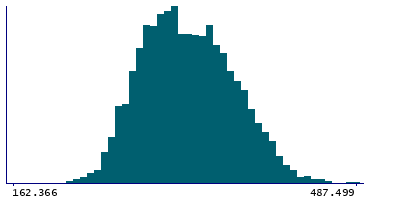
Instance 3 : First repeat imaging visit (2019+)
6,361 participants, 6,361 items
| Maximum | 487.499 |
| Decile 9 | 385.18 |
| Decile 8 | 366.195 |
| Decile 7 | 351.559 |
| Decile 6 | 338.436 |
| Median | 324.778 |
| Decile 4 | 312.134 |
| Decile 3 | 300.405 |
| Decile 2 | 287.792 |
| Decile 1 | 272.427 |
| Minimum | 0 |
|
|
- Mean = 327.078
- Std.dev = 43.8877
- 1 item below graph minimum of 159.674
|