Data
78,765 items of data are available, covering 72,674 participants.
Defined-instances run from 2 to 3, labelled using Instancing
2.
Units of measurement are g.
| Maximum | 1077.94 |
| Decile 9 | 624.315 |
| Decile 8 | 582.147 |
| Decile 7 | 552.724 |
| Decile 6 | 528.76 |
| Median | 506.994 |
| Decile 4 | 485.483 |
| Decile 3 | 463.193 |
| Decile 2 | 438.178 |
| Decile 1 | 404.887 |
| Minimum | 0 |
|

|
- Mean = 511.641
- Std.dev = 86.3302
- 62 items above graph maximum of 843.743
|
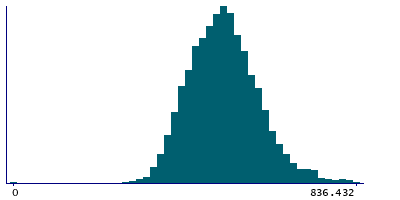
2 Instances
Instance 2 : Imaging visit (2014+)
72,404 participants, 72,404 items
| Maximum | 1077.94 |
| Decile 9 | 624.306 |
| Decile 8 | 582.251 |
| Decile 7 | 552.784 |
| Decile 6 | 528.787 |
| Median | 506.932 |
| Decile 4 | 485.369 |
| Decile 3 | 463.179 |
| Decile 2 | 438.236 |
| Decile 1 | 404.89 |
| Minimum | 0 |
|

|
- Mean = 511.631
- Std.dev = 86.3465
- 60 items above graph maximum of 843.722
|
Instance 3 : First repeat imaging visit (2019+)
6,361 participants, 6,361 items
| Maximum | 884.968 |
| Decile 9 | 624.385 |
| Decile 8 | 580.591 |
| Decile 7 | 552.109 |
| Decile 6 | 528.606 |
| Median | 507.767 |
| Decile 4 | 486.589 |
| Decile 3 | 463.59 |
| Decile 2 | 437.58 |
| Decile 1 | 404.794 |
| Minimum | 0 |
|
|
- Mean = 511.76
- Std.dev = 86.144
- 2 items above graph maximum of 843.977
|