Data
78,246 items of data are available, covering 72,202 participants.
Defined-instances run from 2 to 3, labelled using Instancing
2.
Units of measurement are g/cm2.
| Maximum | 2.21406 |
| Decile 9 | 0.912865 |
| Decile 8 | 0.834867 |
| Decile 7 | 0.781603 |
| Decile 6 | 0.738446 |
| Median | 0.700865 |
| Decile 4 | 0.664353 |
| Decile 3 | 0.627751 |
| Decile 2 | 0.587716 |
| Decile 1 | 0.53768 |
| Minimum | 0 |
|

|
- Mean = 0.715416
- Std.dev = 0.149546
- 128 items above graph maximum of 1.28805
|
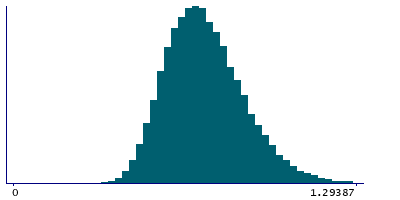
2 Instances
Instance 2 : Imaging visit (2014+)
71,935 participants, 71,935 items
| Maximum | 2.21406 |
| Decile 9 | 0.912938 |
| Decile 8 | 0.834838 |
| Decile 7 | 0.781428 |
| Decile 6 | 0.738229 |
| Median | 0.700629 |
| Decile 4 | 0.664052 |
| Decile 3 | 0.62737 |
| Decile 2 | 0.587402 |
| Decile 1 | 0.537458 |
| Minimum | 0 |
|
|
- Mean = 0.715209
- Std.dev = 0.149752
- 118 items above graph maximum of 1.28842
|
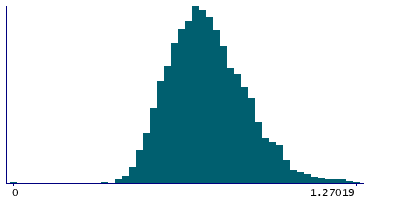
Instance 3 : First repeat imaging visit (2019+)
6,311 participants, 6,311 items
| Maximum | 1.45111 |
| Decile 9 | 0.911924 |
| Decile 8 | 0.835206 |
| Decile 7 | 0.78313 |
| Decile 6 | 0.740486 |
| Median | 0.703111 |
| Decile 4 | 0.668054 |
| Decile 3 | 0.632263 |
| Decile 2 | 0.591378 |
| Decile 1 | 0.540334 |
| Minimum | 0 |
|
|
- Mean = 0.717774
- Std.dev = 0.14716
- 9 items above graph maximum of 1.28351
|