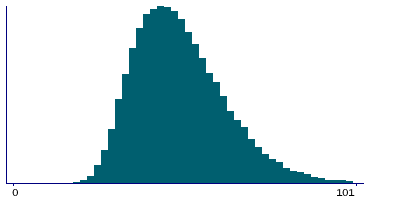
Data
76,891 items of data are available, covering 70,894 participants.
Defined-instances run from 2 to 3, labelled using Instancing
2.
Units of measurement are g.
| Maximum | 217 |
| Decile 9 | 68 |
| Decile 8 | 60 |
| Decile 7 | 55 |
| Decile 6 | 51 |
| Median | 47 |
| Decile 4 | 44 |
| Decile 3 | 41 |
| Decile 2 | 37 |
| Decile 1 | 33 |
| Minimum | 0 |
|
|
- There are 126 distinct values.
- Mean = 49.1618
- Std.dev = 13.9713
- 181 items above graph maximum of 103
|
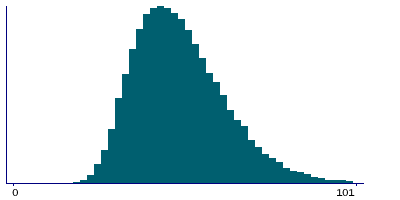
2 Instances
Instance 2 : Imaging visit (2014+)
70,530 participants, 70,530 items
| Maximum | 217 |
| Decile 9 | 68 |
| Decile 8 | 60 |
| Decile 7 | 55 |
| Decile 6 | 51 |
| Median | 47 |
| Decile 4 | 44 |
| Decile 3 | 41 |
| Decile 2 | 37 |
| Decile 1 | 33 |
| Minimum | 0 |
|
|
- There are 125 distinct values.
- Mean = 49.1557
- Std.dev = 13.9634
- 164 items above graph maximum of 103
|
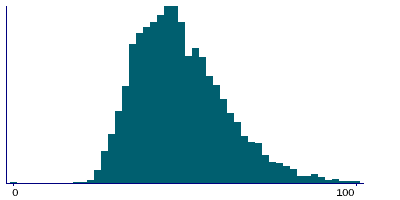
Instance 3 : First repeat imaging visit (2019+)
6,361 participants, 6,361 items
| Maximum | 145 |
| Decile 9 | 68 |
| Decile 8 | 60 |
| Decile 7 | 55 |
| Decile 6 | 51 |
| Median | 47 |
| Decile 4 | 44 |
| Decile 3 | 41 |
| Decile 2 | 37 |
| Decile 1 | 33 |
| Minimum | 0 |
|
|
- There are 101 distinct values.
- Mean = 49.2298
- Std.dev = 14.0584
- 17 items above graph maximum of 103
|
Notes
Value output by DXA system
1 Related Data-Field
| Field ID | Description | Relationship |
|---|
| 20158 | DXA images | Current Field is derived from the images in Field 20158 |
0 Resources
There are no matching Resources
