Data
78,765 items of data are available, covering 72,674 participants.
Defined-instances run from 2 to 3, labelled using Instancing
2.
Units of measurement are g/cm2.
| Maximum | 2.18531 |
| Decile 9 | 1.20023 |
| Decile 8 | 1.12379 |
| Decile 7 | 1.06935 |
| Decile 6 | 1.02506 |
| Median | 0.983882 |
| Decile 4 | 0.944677 |
| Decile 3 | 0.903484 |
| Decile 2 | 0.858224 |
| Decile 1 | 0.800271 |
| Minimum | 0 |
|

|
- Mean = 0.994217
- Std.dev = 0.157042
- 2 items below graph minimum of 0.400309
- 51 items above graph maximum of 1.6002
|
2 Instances
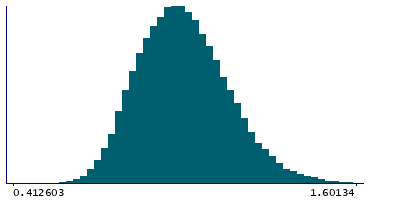
Instance 2 : Imaging visit (2014+)
72,404 participants, 72,404 items
| Maximum | 2.18531 |
| Decile 9 | 1.20082 |
| Decile 8 | 1.12444 |
| Decile 7 | 1.06991 |
| Decile 6 | 1.02556 |
| Median | 0.984253 |
| Decile 4 | 0.945123 |
| Decile 3 | 0.903865 |
| Decile 2 | 0.85864 |
| Decile 1 | 0.800331 |
| Minimum | 0 |
|
|
- Mean = 0.994668
- Std.dev = 0.157287
- 49 items above graph maximum of 1.60131
|
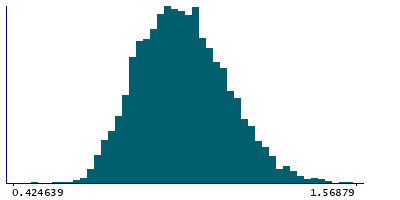
Instance 3 : First repeat imaging visit (2019+)
6,361 participants, 6,361 items
| Maximum | 1.66179 |
| Decile 9 | 1.19388 |
| Decile 8 | 1.11709 |
| Decile 7 | 1.06385 |
| Decile 6 | 1.01964 |
| Median | 0.980459 |
| Decile 4 | 0.940125 |
| Decile 3 | 0.89949 |
| Decile 2 | 0.85427 |
| Decile 1 | 0.799466 |
| Minimum | 0 |
|
|
- Mean = 0.989073
- Std.dev = 0.154137
- 1 item below graph minimum of 0.405056
- 3 items above graph maximum of 1.58828
|