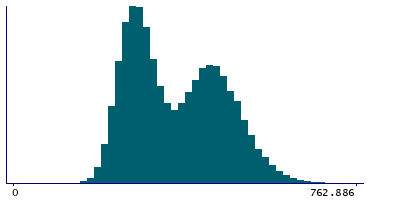
Data
78,765 items of data are available, covering 72,674 participants.
Defined-instances run from 2 to 3, labelled using Instancing
2.
Units of measurement are g.
| Maximum | 772.032 |
| Decile 9 | 500.776 |
| Decile 8 | 460.651 |
| Decile 7 | 428.725 |
| Decile 6 | 393.184 |
| Median | 344.531 |
| Decile 4 | 305.101 |
| Decile 3 | 280.738 |
| Decile 2 | 259.452 |
| Decile 1 | 236.024 |
| Minimum | 0 |
|
|
- Mean = 359.761
- Std.dev = 103.579
- 1 item above graph maximum of 765.528
|
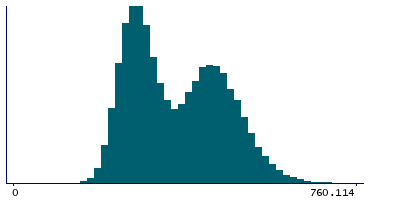
2 Instances
Instance 2 : Imaging visit (2014+)
72,404 participants, 72,404 items
| Maximum | 760.526 |
| Decile 9 | 500.707 |
| Decile 8 | 460.482 |
| Decile 7 | 428.374 |
| Decile 6 | 392.726 |
| Median | 343.924 |
| Decile 4 | 304.876 |
| Decile 3 | 280.491 |
| Decile 2 | 259.334 |
| Decile 1 | 235.978 |
| Minimum | 0 |
|
|
- Mean = 359.541
- Std.dev = 103.563
|
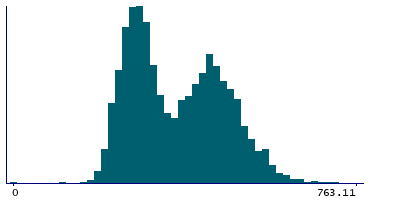
Instance 3 : First repeat imaging visit (2019+)
6,361 participants, 6,361 items
| Maximum | 772.032 |
| Decile 9 | 501.338 |
| Decile 8 | 463.272 |
| Decile 7 | 432.859 |
| Decile 6 | 398.516 |
| Median | 350.607 |
| Decile 4 | 307.361 |
| Decile 3 | 283.462 |
| Decile 2 | 260.928 |
| Decile 1 | 236.883 |
| Minimum | 0 |
|
|
- Mean = 362.268
- Std.dev = 103.726
- 1 item above graph maximum of 765.794
|