Data
49,282 items of data are available, covering 45,937 participants.
Defined-instances run from 2 to 3, labelled using Instancing
2.
Units of measurement are Std.Devs.
| Maximum | 9.89616 |
| Decile 9 | 2.01772 |
| Decile 8 | 1.19959 |
| Decile 7 | 0.654636 |
| Decile 6 | 0.193736 |
| Median | -0.218245 |
| Decile 4 | -0.608674 |
| Decile 3 | -1.02098 |
| Decile 2 | -1.4844 |
| Decile 1 | -2.08243 |
| Minimum | -8.72349 |
|

|
- Mean = -0.0956315
- Std.dev = 1.63927
- 4 items below graph minimum of -6.18257
- 73 items above graph maximum of 6.11786
|
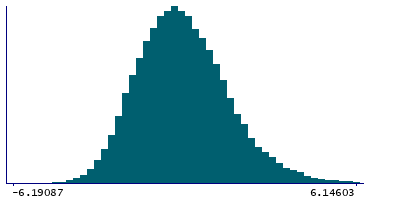
2 Instances
Instance 2 : Imaging visit (2014+)
45,455 participants, 45,455 items
| Maximum | 9.89616 |
| Decile 9 | 2.0341 |
| Decile 8 | 1.21502 |
| Decile 7 | 0.670554 |
| Decile 6 | 0.205363 |
| Median | -0.206162 |
| Decile 4 | -0.601106 |
| Decile 3 | -1.01505 |
| Decile 2 | -1.48053 |
| Decile 1 | -2.07848 |
| Minimum | -8.72349 |
|
|
- Mean = -0.085336
- Std.dev = 1.64487
- 4 items below graph minimum of -6.19105
- 67 items above graph maximum of 6.14667
|
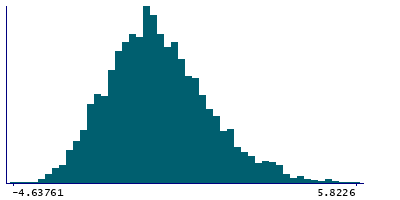
Instance 3 : First repeat imaging visit (2019+)
3,827 participants, 3,827 items
| Maximum | 6.76964 |
| Decile 9 | 1.84512 |
| Decile 8 | 1.01664 |
| Decile 7 | 0.466503 |
| Decile 6 | 0.030898 |
| Median | -0.361209 |
| Decile 4 | -0.686732 |
| Decile 3 | -1.10142 |
| Decile 2 | -1.52823 |
| Decile 1 | -2.13236 |
| Minimum | -4.63761 |
|
|
- Mean = -0.217916
- Std.dev = 1.56599
- 6 items above graph maximum of 5.8226
|