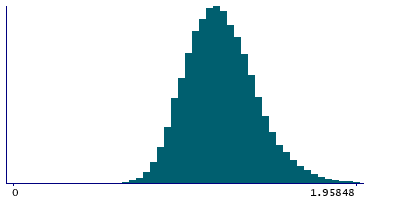
Data
73,670 items of data are available, covering 68,408 participants.
Defined-instances run from 2 to 3, labelled using Instancing
2.
Units of measurement are g/cm2.
| Maximum | 2.40754 |
| Decile 9 | 1.45652 |
| Decile 8 | 1.35222 |
| Decile 7 | 1.28311 |
| Decile 6 | 1.22524 |
| Median | 1.1733 |
| Decile 4 | 1.1223 |
| Decile 3 | 1.0699 |
| Decile 2 | 1.01201 |
| Decile 1 | 0.935689 |
| Minimum | 0.0348996 |
|
|
- Mean = 1.18821
- Std.dev = 0.208134
- 105 items above graph maximum of 1.97735
|
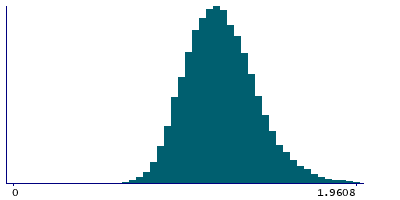
2 Instances
Instance 2 : Imaging visit (2014+)
68,015 participants, 68,015 items
| Maximum | 2.40754 |
| Decile 9 | 1.45753 |
| Decile 8 | 1.35363 |
| Decile 7 | 1.28434 |
| Decile 6 | 1.22622 |
| Median | 1.17441 |
| Decile 4 | 1.12285 |
| Decile 3 | 1.07029 |
| Decile 2 | 1.01229 |
| Decile 1 | 0.936009 |
| Minimum | 0.0348996 |
|
|
- Mean = 1.18891
- Std.dev = 0.208408
- 95 items above graph maximum of 1.97904
|
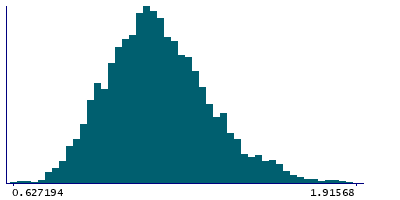
Instance 3 : First repeat imaging visit (2019+)
5,655 participants, 5,655 items
| Maximum | 2.19175 |
| Decile 9 | 1.4442 |
| Decile 8 | 1.33909 |
| Decile 7 | 1.27085 |
| Decile 6 | 1.21276 |
| Median | 1.1628 |
| Decile 4 | 1.11582 |
| Decile 3 | 1.0648 |
| Decile 2 | 1.00851 |
| Decile 1 | 0.931618 |
| Minimum | 0.609207 |
|
|
- Mean = 1.17988
- Std.dev = 0.20463
- 10 items above graph maximum of 1.95679
|