Data
1,481,942 items of data are available, covering 400,877 participants.
Some values have special meanings defined by Data-Coding
13.
Defined-instances run from 0 to 3, labelled using Instancing
2.
Array indices run from 0 to 36.
Units of measurement are years.
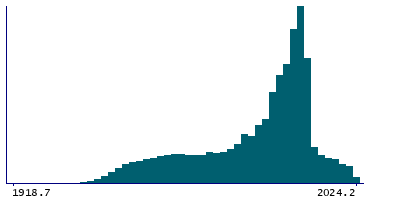
| Maximum | 2025.6 |
| Decile 9 | 2012.5 |
| Decile 8 | 2007.6 |
| Decile 7 | 2005.5 |
| Decile 6 | 2003.2 |
| Median | 1999.5 |
| Decile 4 | 1994.5 |
| Decile 3 | 1986.5 |
| Decile 2 | 1974.7 |
| Decile 1 | 1963.1 |
| Minimum | 1912.5 |
|
|
- Mean = 1993.38
- Std.dev = 18.7074
- 1 item below graph minimum of 1913.7
- 246 items have value -3 (Preferred not to answer)
- 64636 items have value -1 (Date uncertain or unknown)
|
4 Instances
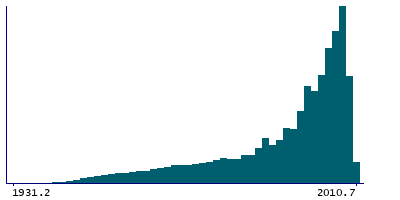
Instance 0 : Initial assessment visit (2006-2010) at which participants were recruited and consent given
374,632 participants, 901,367 items
| Maximum | 2010.7 |
| Decile 9 | 2007.8 |
| Decile 8 | 2006.5 |
| Decile 7 | 2004.5 |
| Decile 6 | 2002.5 |
| Median | 1999.5 |
| Decile 4 | 1996.3 |
| Decile 3 | 1990.5 |
| Decile 2 | 1982.4 |
| Decile 1 | 1969.5 |
| Minimum | 1912.5 |
|
|
- Mean = 1994.08
- Std.dev = 15.2016
- 1 item below graph minimum of 1931.2
- 222 items have value -3 (Preferred not to answer)
- 32246 items have value -1 (Date uncertain or unknown)
|
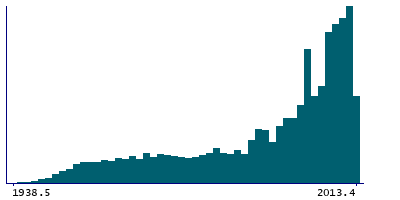
Instance 1 : First repeat assessment visit (2012-13)
16,989 participants, 54,819 items
| Maximum | 2013.4 |
| Decile 9 | 2011.5 |
| Decile 8 | 2009.5 |
| Decile 7 | 2007.5 |
| Decile 6 | 2004.4 |
| Median | 2000.8 |
| Decile 4 | 1995.5 |
| Decile 3 | 1987.5 |
| Decile 2 | 1976.5 |
| Decile 1 | 1963.5 |
| Minimum | 1938.5 |
|
|
- Mean = 1993.79
- Std.dev = 18.187
- 5 items have value -3 (Preferred not to answer)
- 818 items have value -1 (Date uncertain or unknown)
|
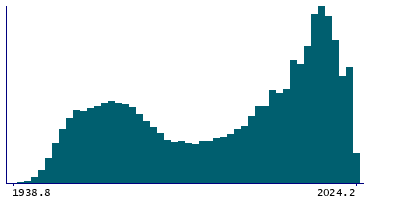
Instance 2 : Imaging visit (2014+)
79,318 participants, 390,007 items
| Maximum | 2025.6 |
| Decile 9 | 2019.8 |
| Decile 8 | 2015.7 |
| Decile 7 | 2011.9 |
| Decile 6 | 2005.9 |
| Median | 1998.5 |
| Decile 4 | 1985.5 |
| Decile 3 | 1972.7 |
| Decile 2 | 1965 |
| Decile 1 | 1957.8 |
| Minimum | 1938.8 |
|
|
- Mean = 1992.04
- Std.dev = 23.8886
- 16 items have value -3 (Preferred not to answer)
- 23739 items have value -1 (Date uncertain or unknown)
|
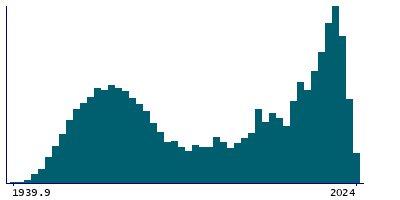
Instance 3 : First repeat imaging visit (2019+)
13,401 participants, 70,867 items
| Maximum | 2025.6 |
| Decile 9 | 2021.8 |
| Decile 8 | 2018.5 |
| Decile 7 | 2014.2 |
| Decile 6 | 2006.5 |
| Median | 1996.7 |
| Decile 4 | 1981.5 |
| Decile 3 | 1969.9 |
| Decile 2 | 1963.4 |
| Decile 1 | 1956.8 |
| Minimum | 1939.9 |
|
|
- Mean = 1991.6
- Std.dev = 25.3573
- 3 items have value -3 (Preferred not to answer)
- 7833 items have value -1 (Date uncertain or unknown)
|
Notes
This is the interpolated time when the participant indicated the corresponding condition was first diagnosed by a doctor, measured in years.
- If the participant gave a calendar year, then the best-fit time is half-way through that year. For example if the year was given as 1970, then the value presented is 1970.5
- If the participant gave their age then the value presented is the fractional year corresponding to the mid-point of that age. For example, if the participant said they were 30 years old then the value is the date at which they were 30years+6months.
- Interpolated values before the date of birth were truncated forwards to that time.
- Interpolated values after the time of data acquisition were truncated back to that time.
Coding 13 defines 2 special values:
- -1 represents "Date uncertain or unknown"
- -3 represents "Preferred not to answer"


