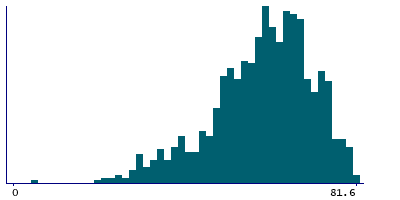
Data
64,798 items of data are available, covering 52,398 participants.
Some values have special meanings defined by Data-Coding
13.
Defined-instances run from 0 to 3, labelled using Instancing
2.
Array indices run from 0 to 5.
Units of measurement are years.
| Maximum | 86.2 |
| Decile 9 | 67.1 |
| Decile 8 | 63.5 |
| Decile 7 | 60.5 |
| Decile 6 | 57.95 |
| Median | 55.1 |
| Decile 4 | 51.9 |
| Decile 3 | 48.5 |
| Decile 2 | 43.6 |
| Decile 1 | 36.5 |
| Minimum | 0 |
|
|
- Mean = 53.4329
- Std.dev = 12.0619
- 297 items have value -1 (Date uncertain or unknown)
|
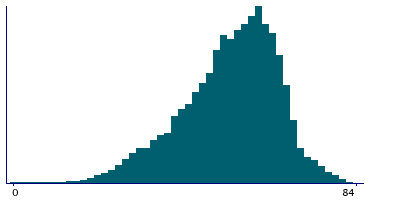
4 Instances
Instance 0 : Initial assessment visit (2006-2010) at which participants were recruited and consent given
41,658 participants, 44,653 items
| Maximum | 70 |
| Decile 9 | 64 |
| Decile 8 | 61 |
| Decile 7 | 58.5 |
| Decile 6 | 55.8 |
| Median | 53 |
| Decile 4 | 50.1 |
| Decile 3 | 46.5 |
| Decile 2 | 41.9 |
| Decile 1 | 35.2 |
| Minimum | 0 |
|
|
- Mean = 51.0888
- Std.dev = 11.2047
- 100 items have value -1 (Date uncertain or unknown)
|
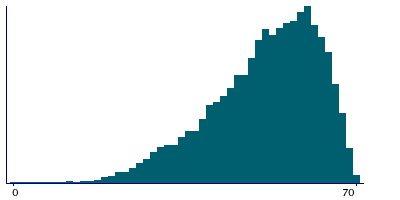
Instance 1 : First repeat assessment visit (2012-13)
2,277 participants, 2,427 items
| Maximum | 74.5 |
| Decile 9 | 67.6 |
| Decile 8 | 64.6 |
| Decile 7 | 62.15 |
| Decile 6 | 59.7 |
| Median | 56.8 |
| Decile 4 | 53.6 |
| Decile 3 | 50.2 |
| Decile 2 | 45.8 |
| Decile 1 | 38.5 |
| Minimum | 7 |
|
|
- Mean = 54.7115
- Std.dev = 11.3351
- 3 items have value -1 (Date uncertain or unknown)
|
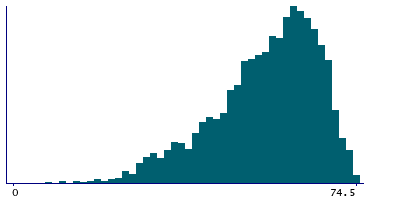
Instance 2 : Imaging visit (2014+)
13,765 participants, 15,042 items
| Maximum | 85.5 |
| Decile 9 | 73.3 |
| Decile 8 | 69.6 |
| Decile 7 | 66.55 |
| Decile 6 | 63.7 |
| Median | 60.5 |
| Decile 4 | 57.5 |
| Decile 3 | 54 |
| Decile 2 | 49.6 |
| Decile 1 | 42.2 |
| Minimum | 0.5 |
|
|
- Mean = 59.0026
- Std.dev = 12.2217
- 83 items have value -1 (Date uncertain or unknown)
|
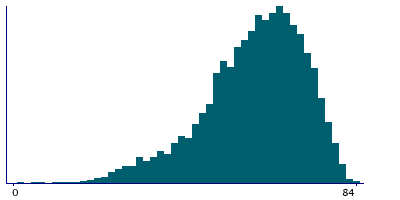
Instance 3 : First repeat imaging visit (2019+)
2,289 participants, 2,379 items
| Maximum | 86.2 |
| Decile 9 | 75.5 |
| Decile 8 | 71.8 |
| Decile 7 | 68.3 |
| Decile 6 | 65.5 |
| Median | 62.5 |
| Decile 4 | 59.4 |
| Decile 3 | 55.5 |
| Decile 2 | 51.3 |
| Decile 1 | 44 |
| Minimum | 5.5 |
|
|
- Mean = 60.9111
- Std.dev = 12.4824
- 111 items have value -1 (Date uncertain or unknown)
|
Notes
This is the interpolated time when the participant indicated the corresponding cancer was first diagnosed by a doctor, given as their estimated age.
- If the participant gave a calendar year, then the best-fit time is their age at the mid-point of that year. For example if the year was given as 1970, and the participant was born on 1 April 1950, then their age on 1st July 1970 is 20.25
then the value presented is 1970.5 - If the participant gave their age then the value presented is the fractional year corresponding to the mid-point of that age. For example, if the participant said they were 30 years old then the value is 30.5
- Interpolated values before the date of birth were truncated forwards to that time.
- Interpolated values after the time of data acquisition were truncated back to that time.
Coding 13 defines 2 special values:
- -1 represents "Date uncertain or unknown"
- -3 represents "Preferred not to answer"


